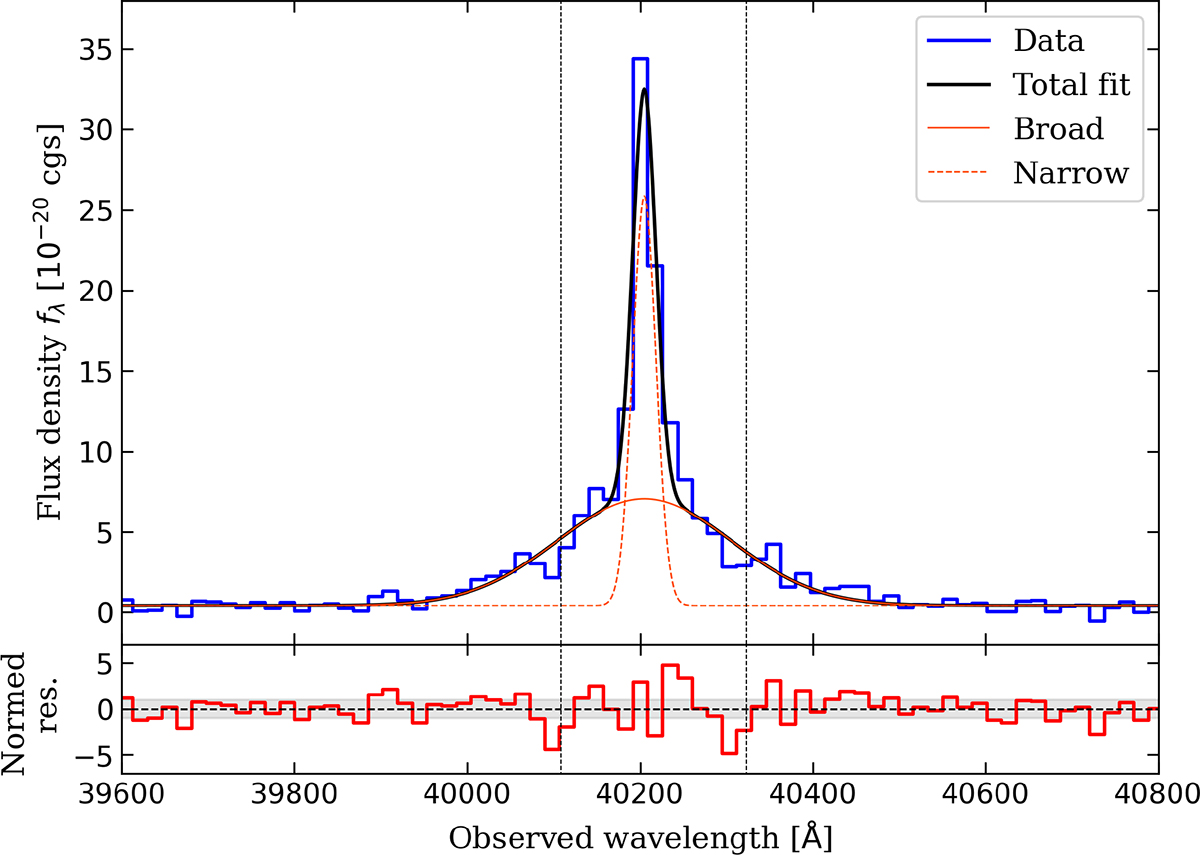
Fig. 5.
Download original image
Hα fit (black line) for the tLRD compared with the data (blue). The spectrum was rebinned in wavelength to improve the S/N and readability. The solid (dashed) red line shows the fit to the broad (narrow) component. The normalized residuals (spectrum – model, normalized by the error) are displayed underneath. The shaded gray region corresponds to ±1σ.
Current usage metrics show cumulative count of Article Views (full-text article views including HTML views, PDF and ePub downloads, according to the available data) and Abstracts Views on Vision4Press platform.
Data correspond to usage on the plateform after 2015. The current usage metrics is available 48-96 hours after online publication and is updated daily on week days.
Initial download of the metrics may take a while.