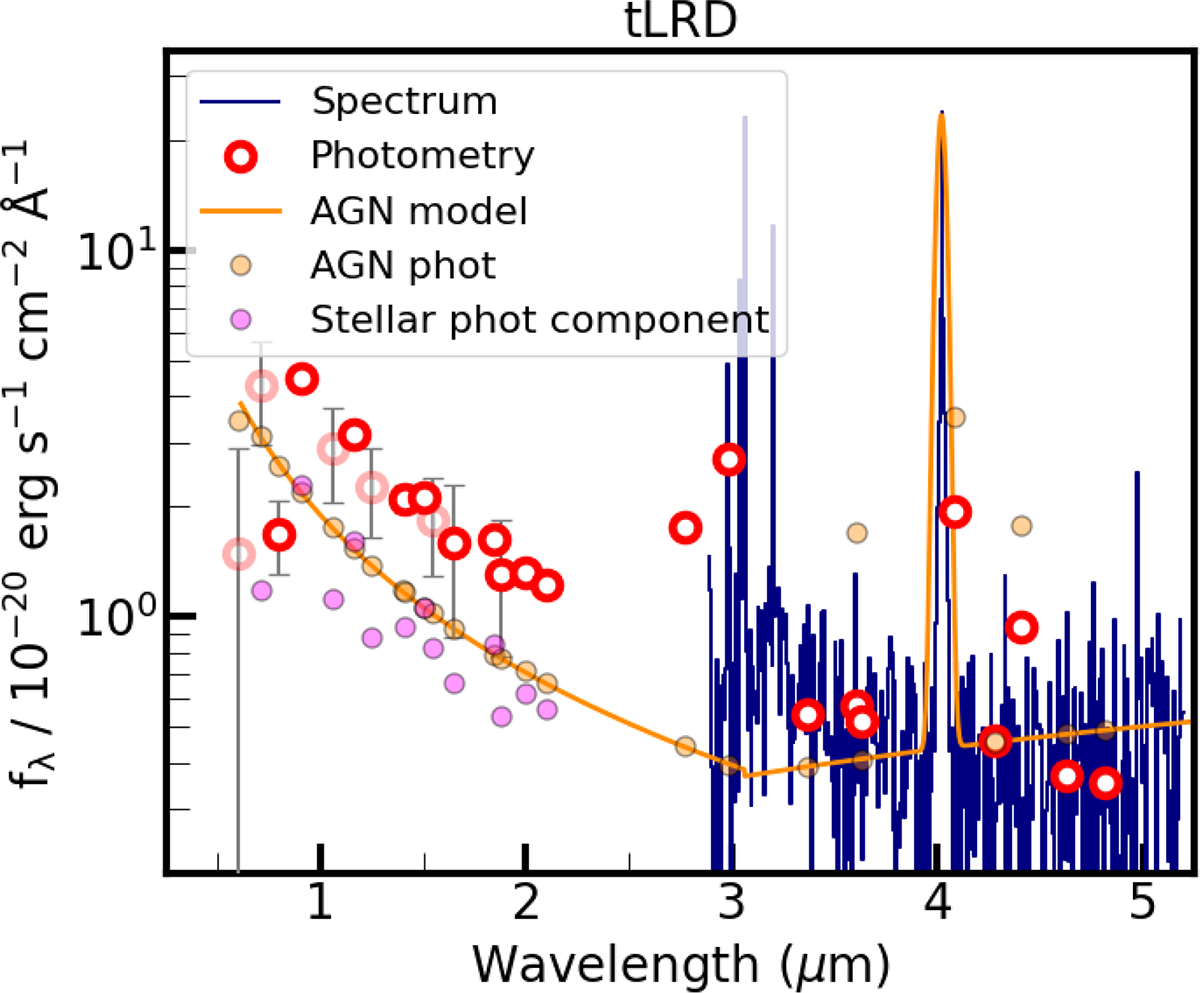
Fig. 6.
Download original image
Spectrum (blue) and photometry (open red circles) of the tLRD source, together with the AGN model extracted from Bagpipes (orange). The photometric points associated with the model are shown as orange circles. The photometry linked to the stellar component, obtained by subtracting the AGN model photometry from the observed photometry, is displayed as fuchsia circles. In the optical, the AGN model photometry lies above both the photometry and the photometric points derived from the spectrum.
Current usage metrics show cumulative count of Article Views (full-text article views including HTML views, PDF and ePub downloads, according to the available data) and Abstracts Views on Vision4Press platform.
Data correspond to usage on the plateform after 2015. The current usage metrics is available 48-96 hours after online publication and is updated daily on week days.
Initial download of the metrics may take a while.