Open Access
Fig. 7.
Download original image
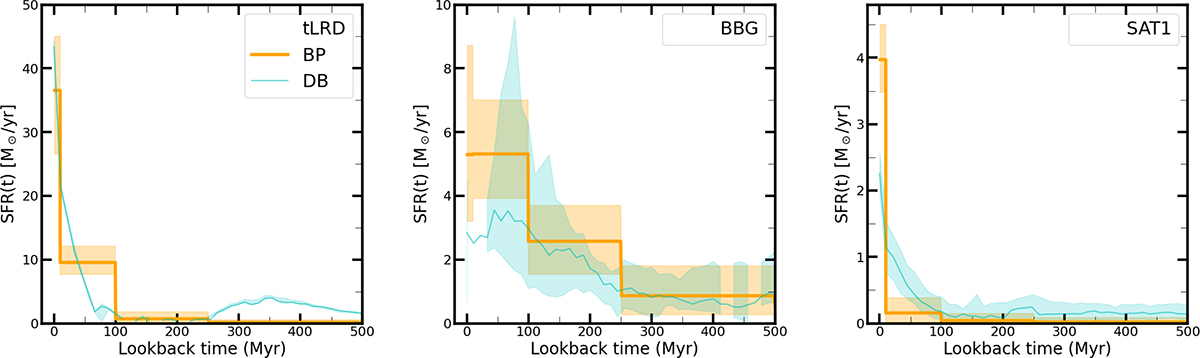
Star formation histories of the tLRD (left), BBG (middle), and SAT1 (right), obtained using Bagpipes (orange; based on the Leja et al. 2019 approach) and Dense Basis (cyan). The shaded regions indicate the 16th–84th percentile range.
Current usage metrics show cumulative count of Article Views (full-text article views including HTML views, PDF and ePub downloads, according to the available data) and Abstracts Views on Vision4Press platform.
Data correspond to usage on the plateform after 2015. The current usage metrics is available 48-96 hours after online publication and is updated daily on week days.
Initial download of the metrics may take a while.