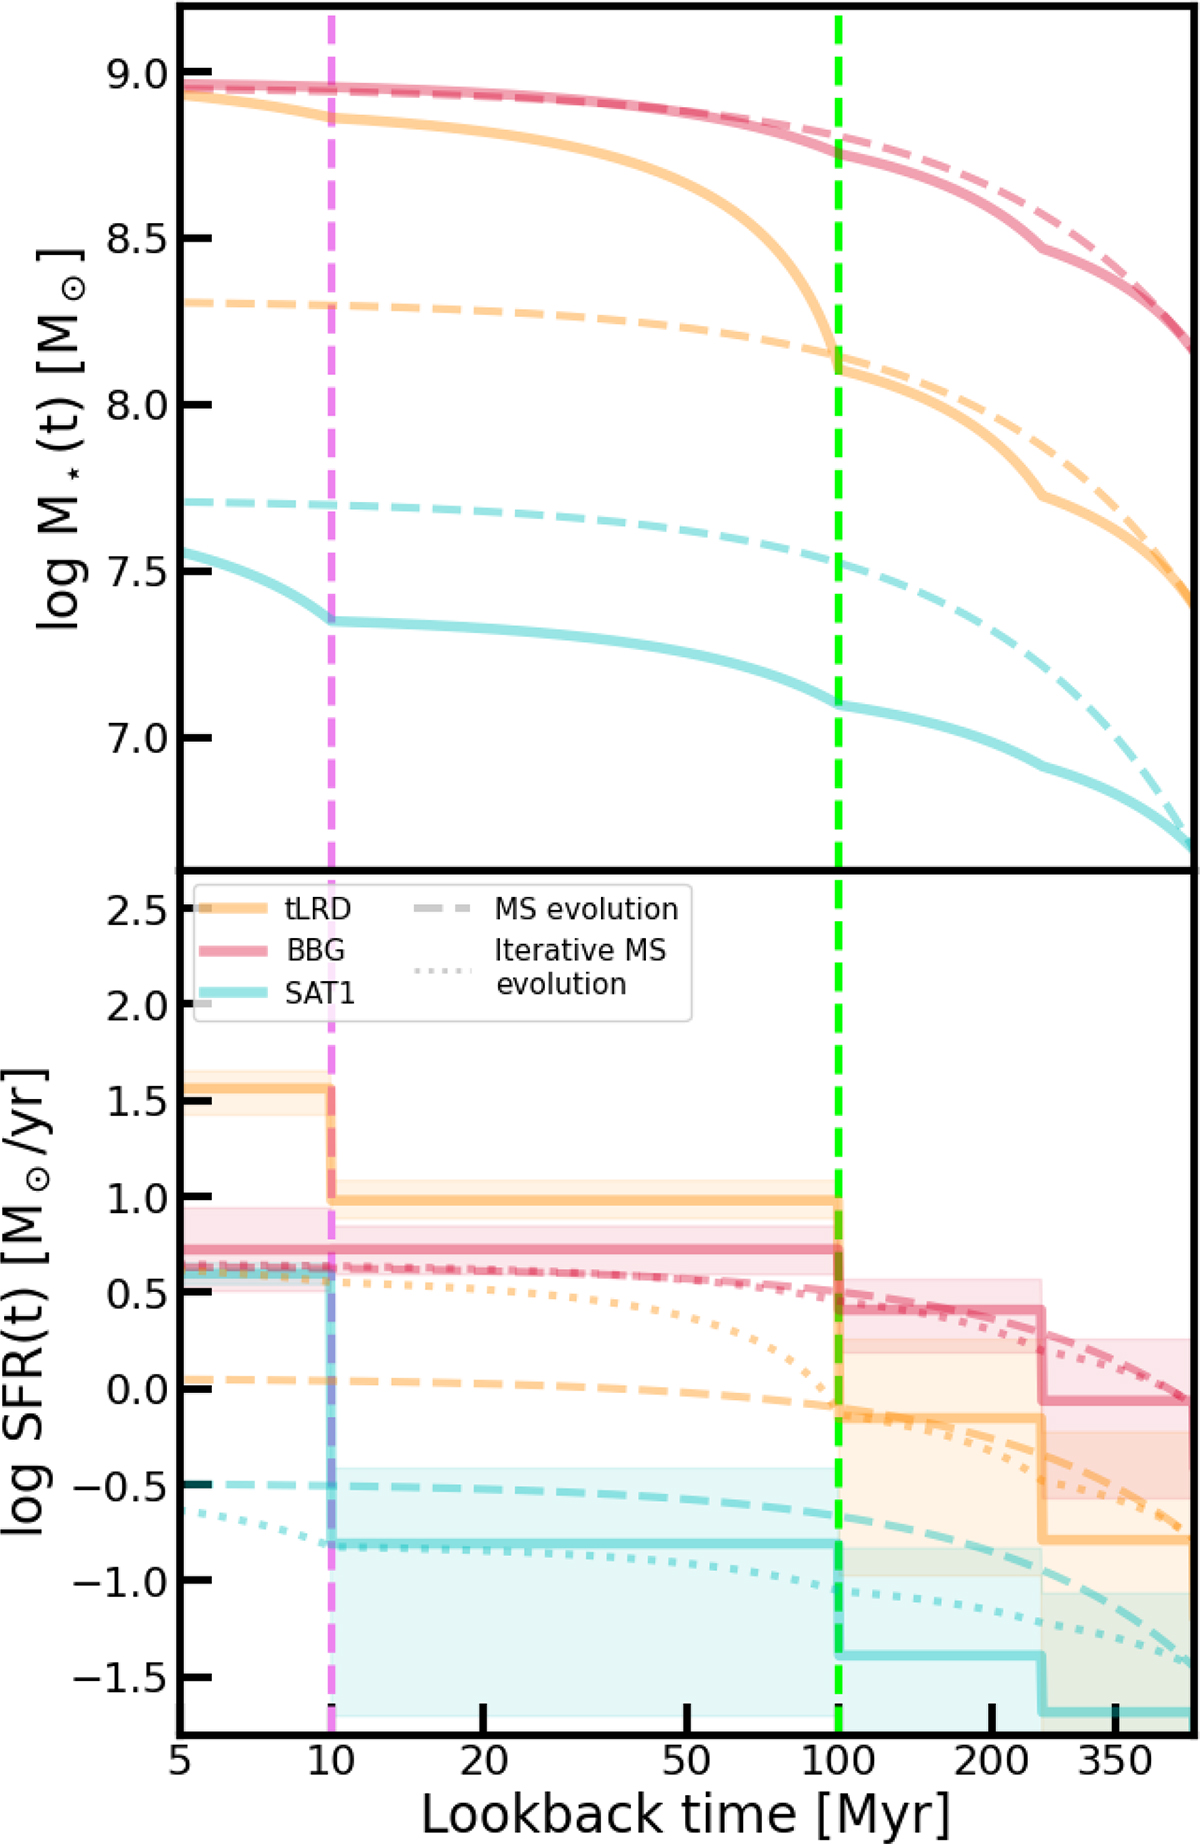
Fig. 8.
Download original image
Top: Mass assembly histories of the tLRD (solid orange), BBG (solid red), and SAT1 (solid cyan) shown on a logarithmic scale. The dashed lines in the same colors indicate the mass growth of these galaxies, assuming that they follow the main sequence. To compute the MS tracks, we used the main sequence fit from Mérida et al. (2026) at 5 < z ≤ 7 and the M★ of the sources at t = 500 Myr. We assumed a return fraction of 0.3. Vertical lines highlight t = 10 Myr (violet) and t = 100 Myr (lime). Bottom: SFHs of our sources, following the same color code. The SFHs of analogous galaxies evolving along the main sequence since t = 500 Myr ago are also depicted. The dotted lines display the MS evolution resetting the seed mass to that achieved in each time bin. The shaded region shows the SFH uncertainty of each source. The scatter of the main sequence, which is ∼0.2 dex at this redshift, should also be considered.
Current usage metrics show cumulative count of Article Views (full-text article views including HTML views, PDF and ePub downloads, according to the available data) and Abstracts Views on Vision4Press platform.
Data correspond to usage on the plateform after 2015. The current usage metrics is available 48-96 hours after online publication and is updated daily on week days.
Initial download of the metrics may take a while.