Fig. 9.
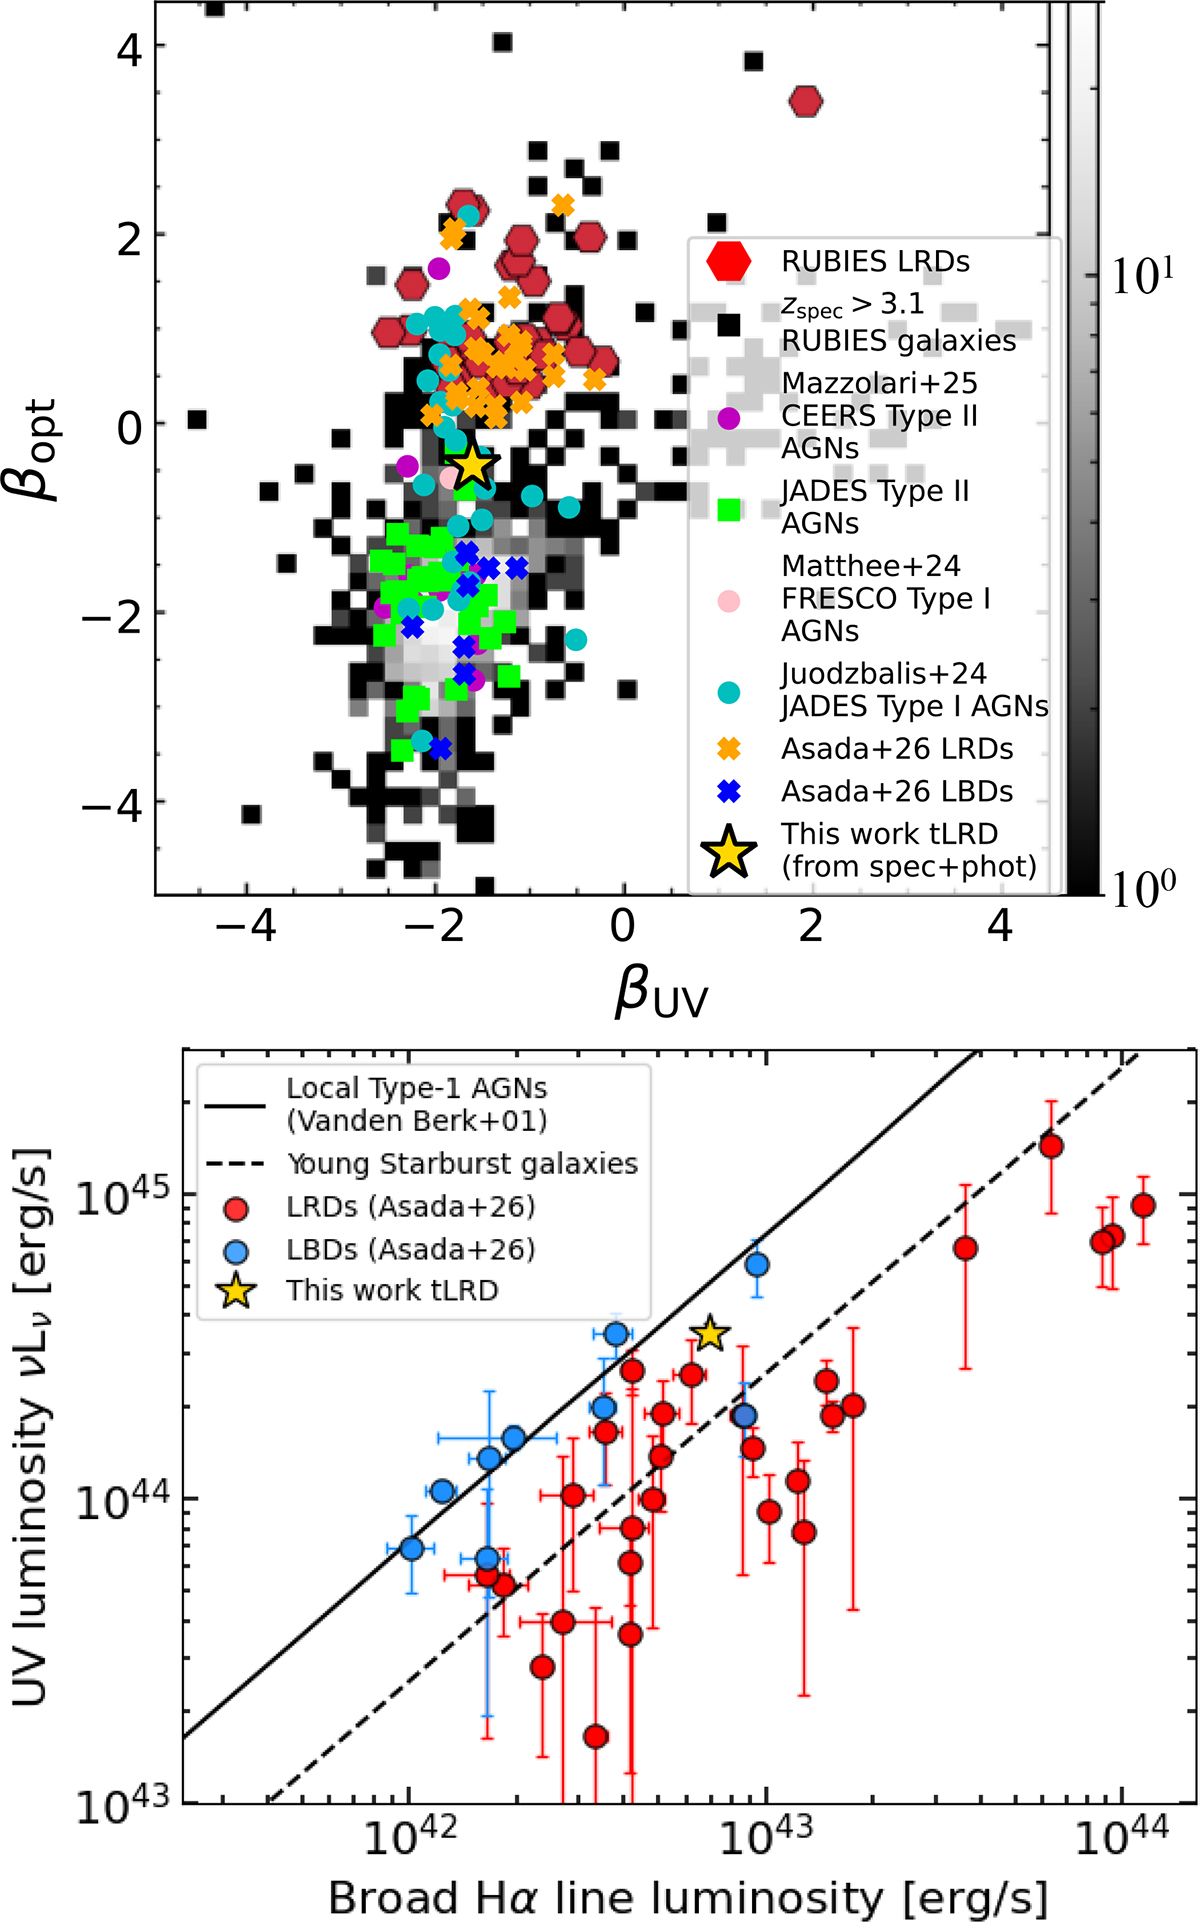
Download original image
Adapted versions of Fig. 6 (top) from Hviding et al. (2025) and Fig. 3 (bottom) from Asada et al. (2026) showing βopt vs. βUV and UV luminosity νLν vs. the broad LHα for a sample of LRDs and non-LRDs. Top: We compared tLRD (yellow star) with the LRDs selected in RUBIES (red hexagons) and Asada et al. (2026) (orange crosses). Hviding et al. (2025) included zspec > 3.1 galaxies from RUBIES as 2D grayscale histograms. We added sources from Mazzolari et al. (2025) (magenta circles); Type II AGNs from JADES (lime squares) (Scholtz et al. 2025); a Type I AGN from Matthee et al. (2024) (pink circle); and Type I AGNs from Juodžbalis et al. (2025) (cyan circles), all extracted from Hainline et al. (2025). Little Blue Dots (LBDs) from Asada et al. (2026) are represented as blue crosses. Bottom: tLRD (yellow star) is compared to the LRDs and LBDs (red and blue points) from Asada et al. (2026). We included the typical relation for local Type I AGNs (solid line; Vanden Berk et al. 2001) and young starburst galaxies (dashed line; from BPASS+Cloudy photoionization modeling). The LHα for tLRD was derived from the spectrum (see Table 3), selecting the broad component. νLν was estimated from the photometry. Both quantities were corrected for dust attenuation following Asada et al. (2026).
Current usage metrics show cumulative count of Article Views (full-text article views including HTML views, PDF and ePub downloads, according to the available data) and Abstracts Views on Vision4Press platform.
Data correspond to usage on the plateform after 2015. The current usage metrics is available 48-96 hours after online publication and is updated daily on week days.
Initial download of the metrics may take a while.