Open Access
Fig. 3.
Download original image
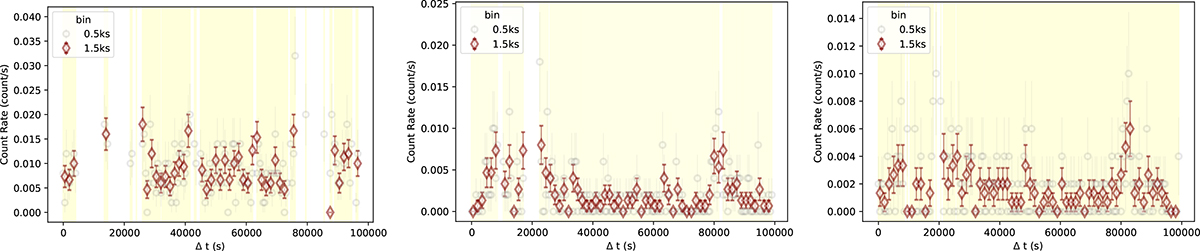
K2-18 XMM-Newton light curves from left to right: PN, MOS1, and MOS2, showing quasi-quiescent activity. The yellow background marks the good time interval (GTI) from each detector. Two light curves are plotted with different time binnings (gray 0.5 ks bin and brown 1.5 ks bin).
Current usage metrics show cumulative count of Article Views (full-text article views including HTML views, PDF and ePub downloads, according to the available data) and Abstracts Views on Vision4Press platform.
Data correspond to usage on the plateform after 2015. The current usage metrics is available 48-96 hours after online publication and is updated daily on week days.
Initial download of the metrics may take a while.