Fig. 4.
Download original image
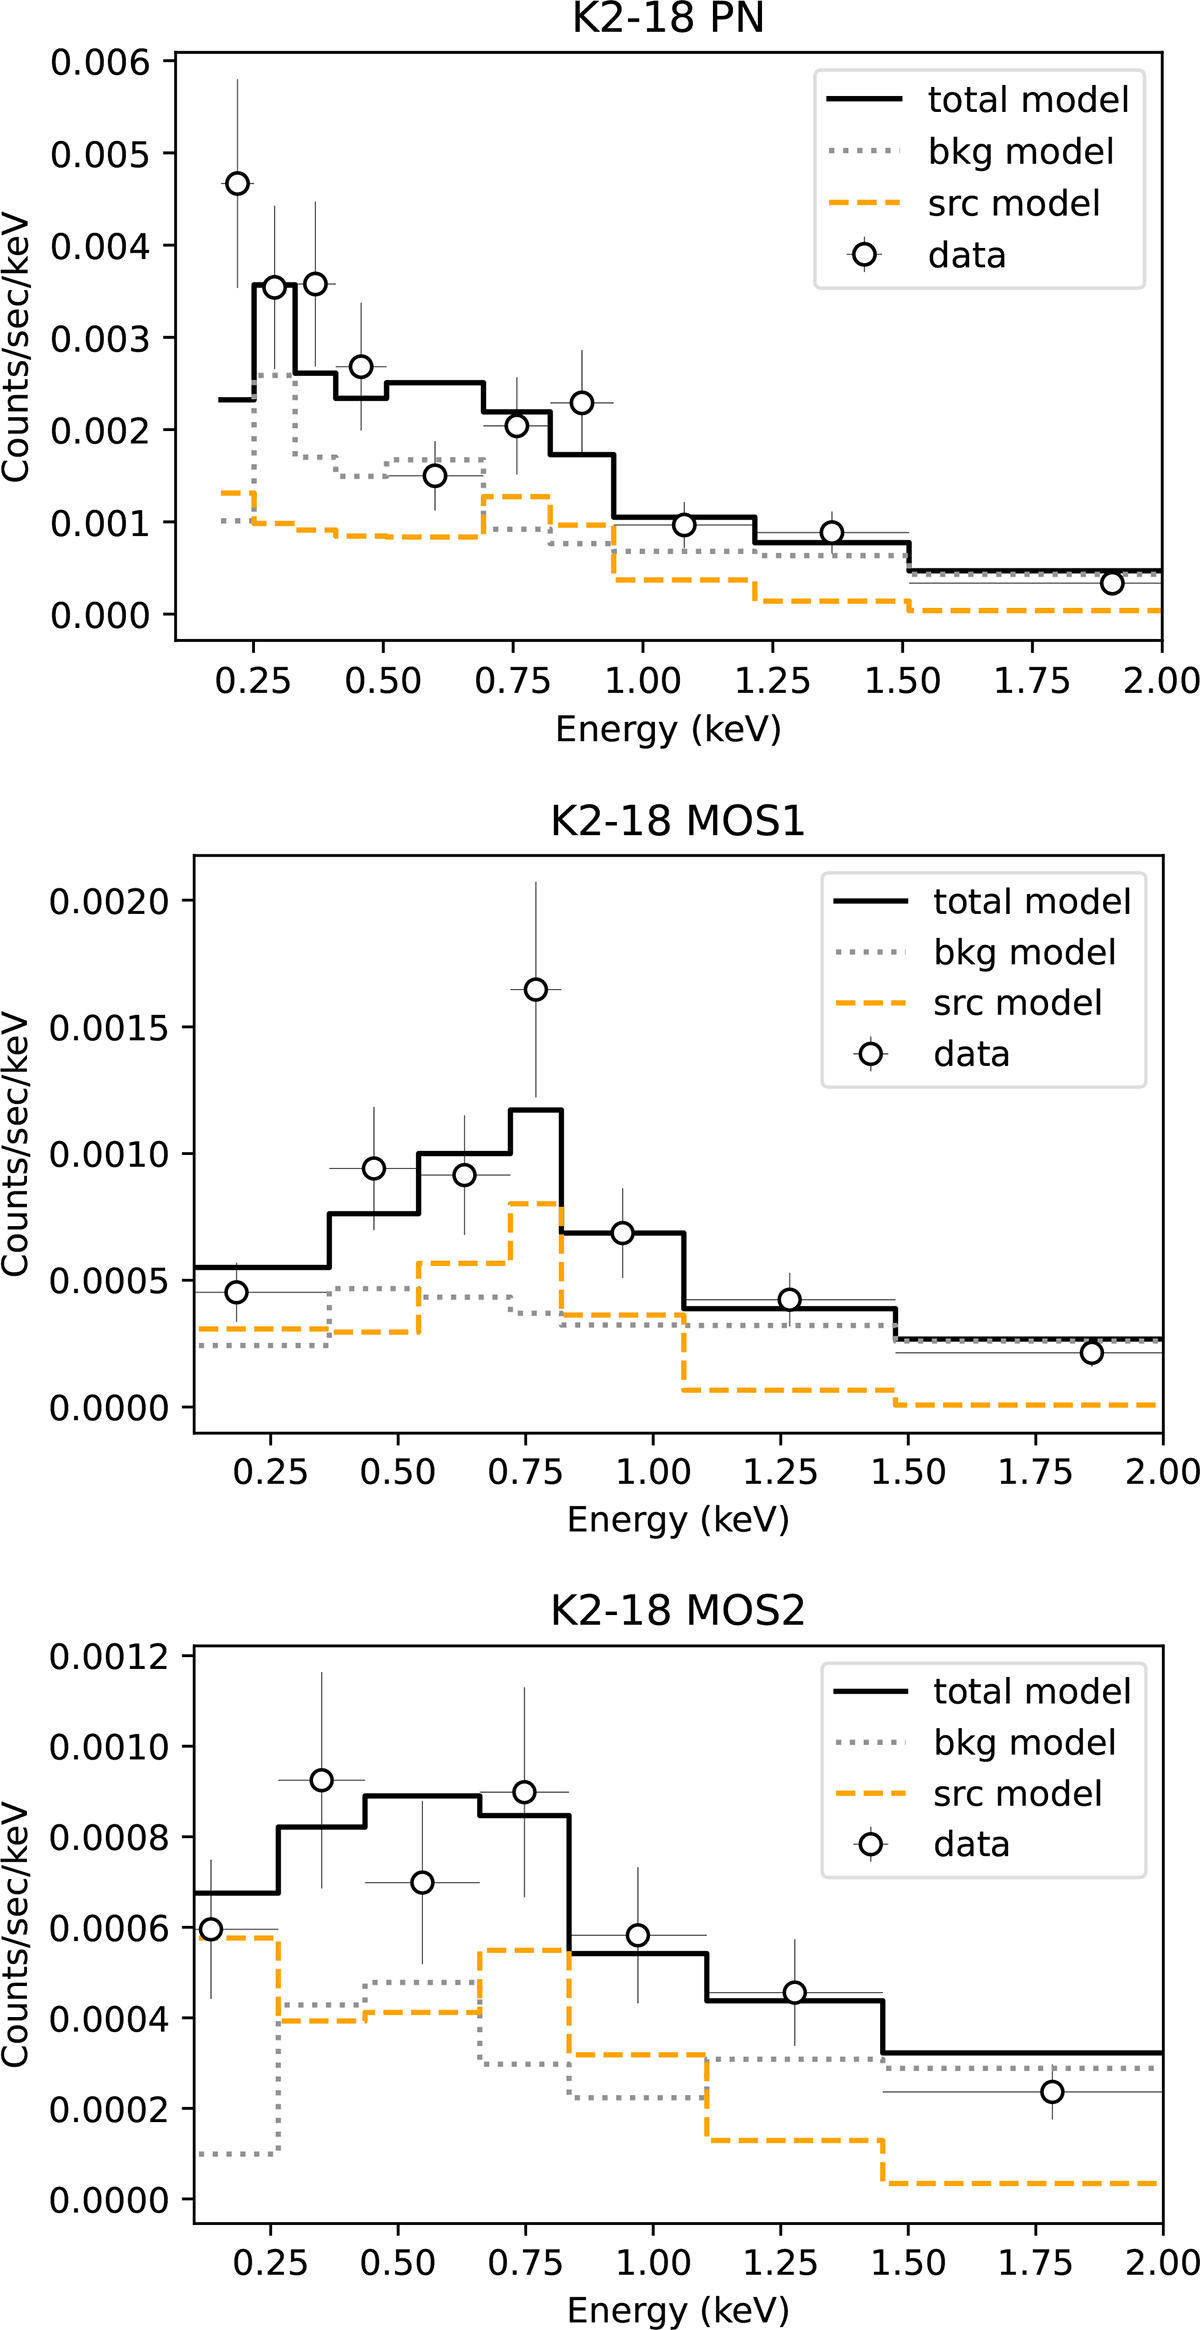
X-ray spectrum of K2-18 analyzed over the 0.2–2.0 keV range, extracted from the PN-CCD (top), MOS1 (middle), and MOS2 (bottom) on XMM-Newton during a 100 ks observation. The solid black line is the spectral model through BXA-Plasma, the dashed orange line is the source model, and the dotted gray line is the background model with PCA routine in BXA.
Current usage metrics show cumulative count of Article Views (full-text article views including HTML views, PDF and ePub downloads, according to the available data) and Abstracts Views on Vision4Press platform.
Data correspond to usage on the plateform after 2015. The current usage metrics is available 48-96 hours after online publication and is updated daily on week days.
Initial download of the metrics may take a while.