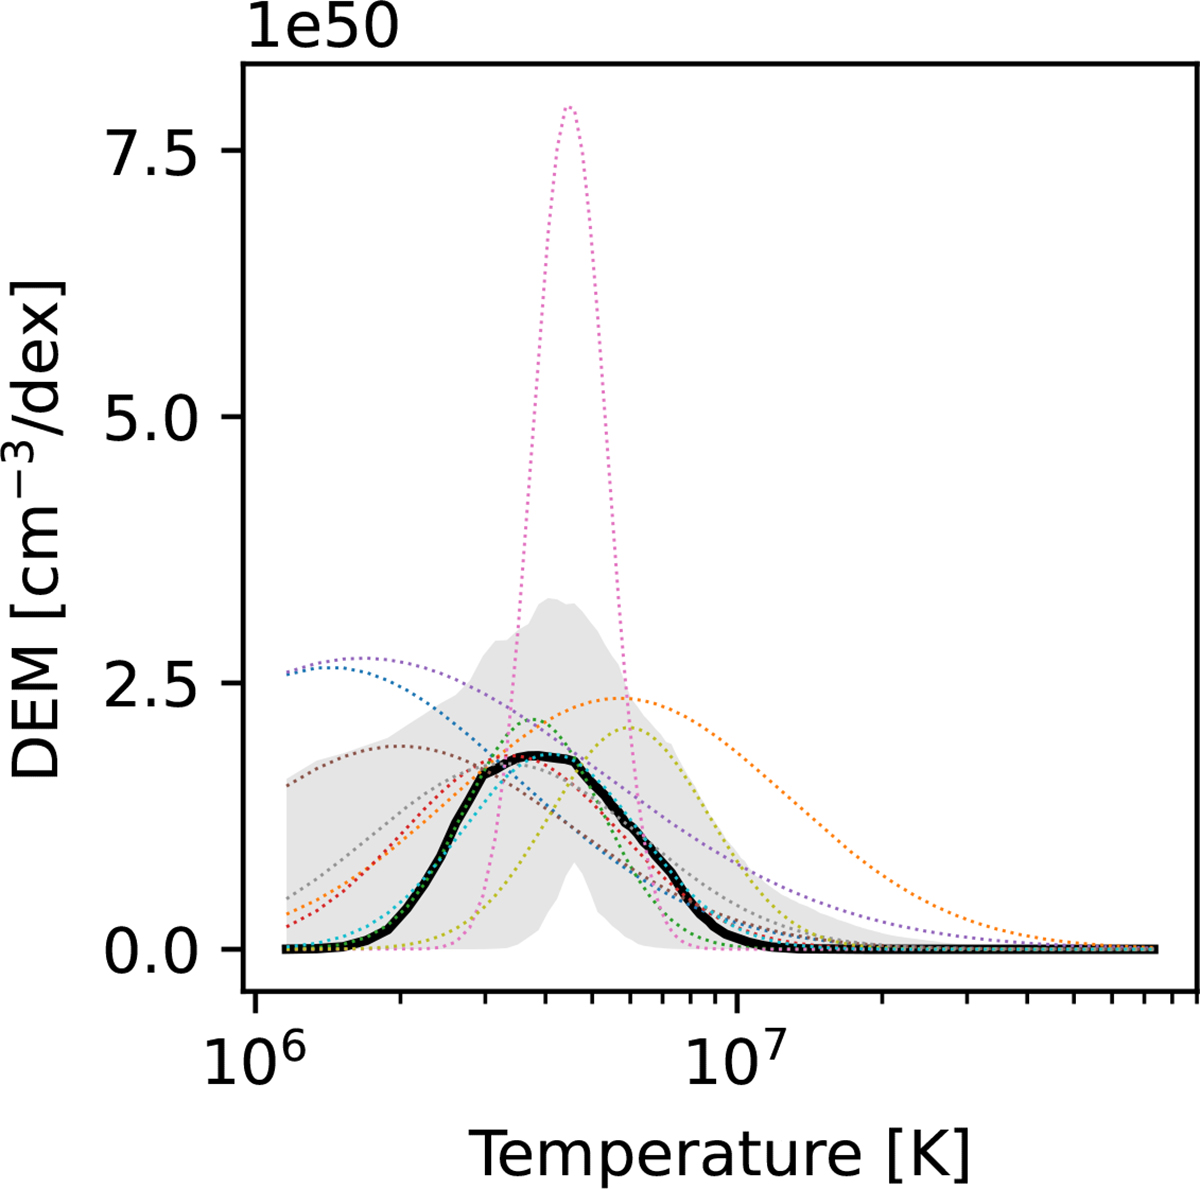
Fig. 5.
Download original image
Reconstructed continuous DEM distribution from MOS1. The black curve shows the median of the posterior DEM predictions, and the gray band contains 68% of the distribution. The colorful dotted lines are ten random posterior samples of possible DEM distributions. Note that the kT values from PN and MOS2 are not well constrained and are not shown here.
Current usage metrics show cumulative count of Article Views (full-text article views including HTML views, PDF and ePub downloads, according to the available data) and Abstracts Views on Vision4Press platform.
Data correspond to usage on the plateform after 2015. The current usage metrics is available 48-96 hours after online publication and is updated daily on week days.
Initial download of the metrics may take a while.