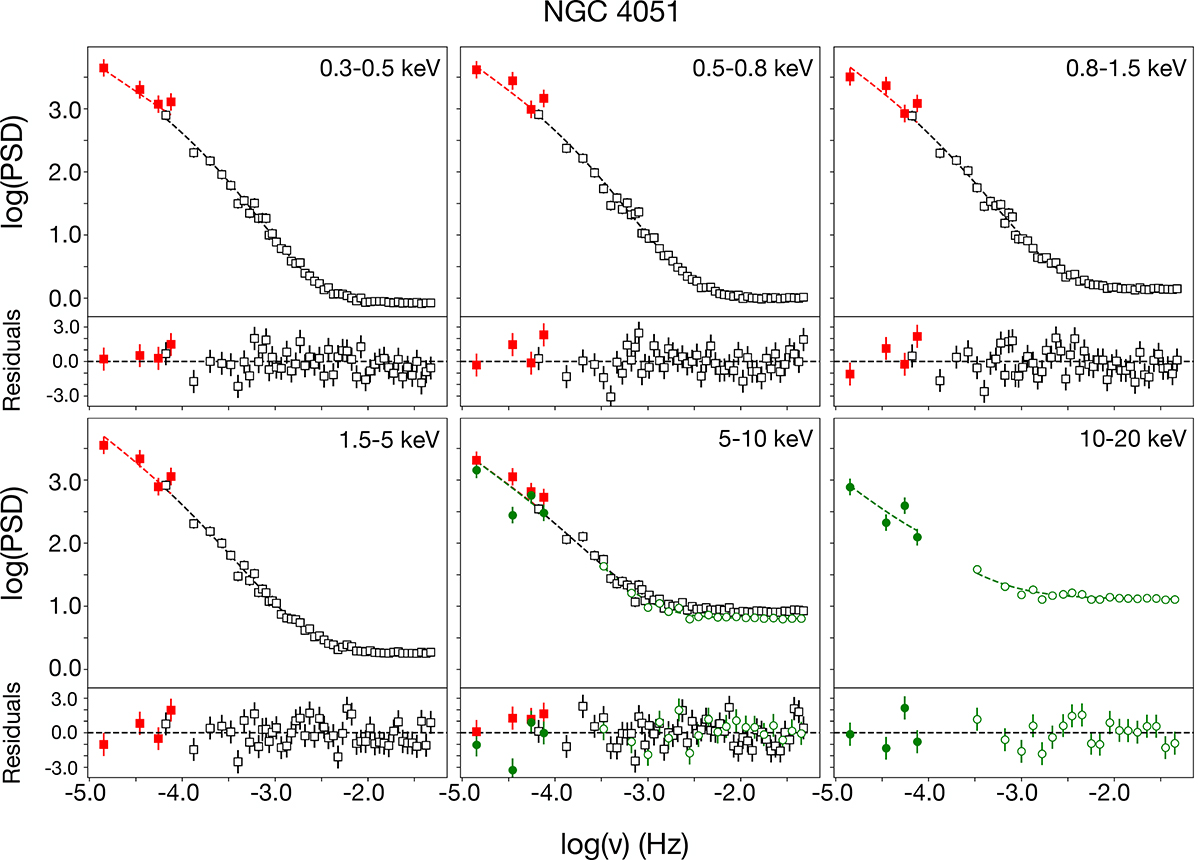
Fig. 2.
Download original image
Observed PSDs of NGC 4051 in the various energy bands we considered in this work. Open black squares and open green circles indicate the XMM-Newton and NuSTAR high frequency power spectra, respectively. Errors are plotted in all points, but they are smaller than the symbol size at high frequencies. Filled red squares and filled green circles indicate the low-frequency Suzaku and NuSTAR power spectra, respectively. The dashed lines indicate the best-fit BPL models to the PSDs at energies lower than 10 keV. For the 10–20 keV band, the dashed green lines correspond to the best-fit PL model. The bottom sub-panels display the best-fit residuals, with points colour-coded in the same manner (residuals were calculated as the difference between observed and model PSDs divided by the error of the PSDs).
Current usage metrics show cumulative count of Article Views (full-text article views including HTML views, PDF and ePub downloads, according to the available data) and Abstracts Views on Vision4Press platform.
Data correspond to usage on the plateform after 2015. The current usage metrics is available 48-96 hours after online publication and is updated daily on week days.
Initial download of the metrics may take a while.