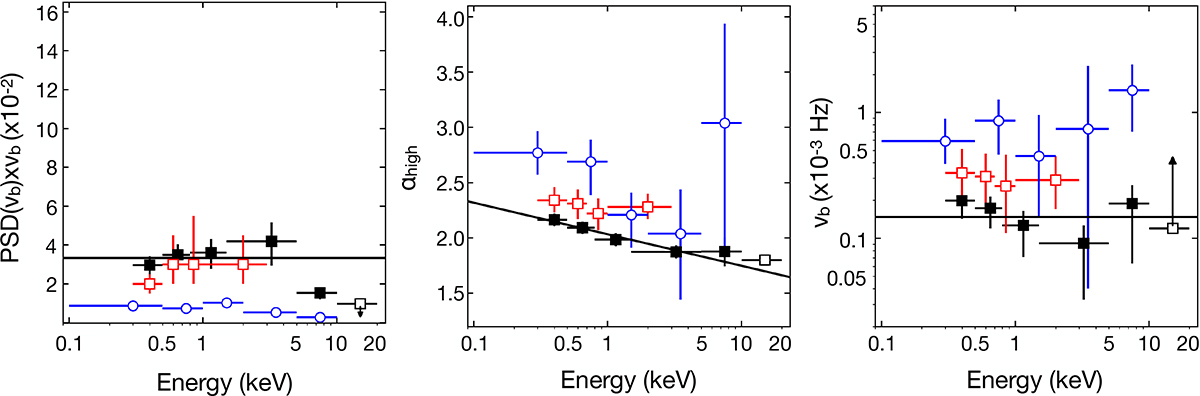
Fig. 4.
Download original image
The energy dependence of the PSD parameters of NGC 4051. The solid black squares show the best-fit, BPL model parameters plotted as a function of energy for NGC 4051. Open red squares and open blue circles show the respective results from Rani et al. (2025), and from McHardy et al. (2004), respectively. The solid lines indicate the weighted PSDamp of the four lowest energy points in the left panel, the best-fit log-linear model to the αhigh − E data in the middle panel, and the weighted bending frequency in the right panel. Note that, for comparison reasons, the y axis limits are the same in the relevant panels in this figure and in Fig. 5.
Current usage metrics show cumulative count of Article Views (full-text article views including HTML views, PDF and ePub downloads, according to the available data) and Abstracts Views on Vision4Press platform.
Data correspond to usage on the plateform after 2015. The current usage metrics is available 48-96 hours after online publication and is updated daily on week days.
Initial download of the metrics may take a while.