Open Access
Fig. A.3.
Download original image
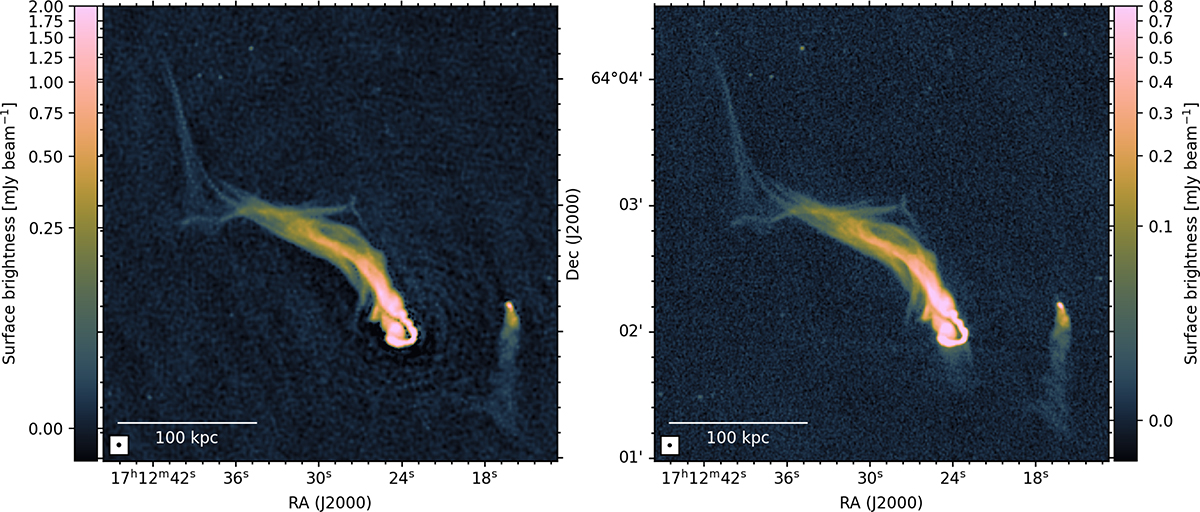
Original TRG radio maps at GHz frequencies. Left: uGMRT map of A2255. Total intensity image in Band 5 (central frequency 1260 MHz), resolution 1.5″ × 1.5″, rms noise 5 μJy beam−1. Right: VLA map of A2255. Total intensity image in L-band (central frequency 1520 MHz), resolution 1.3″ × 1.2″, rms noise 3 μJy beam−1.
Current usage metrics show cumulative count of Article Views (full-text article views including HTML views, PDF and ePub downloads, according to the available data) and Abstracts Views on Vision4Press platform.
Data correspond to usage on the plateform after 2015. The current usage metrics is available 48-96 hours after online publication and is updated daily on week days.
Initial download of the metrics may take a while.