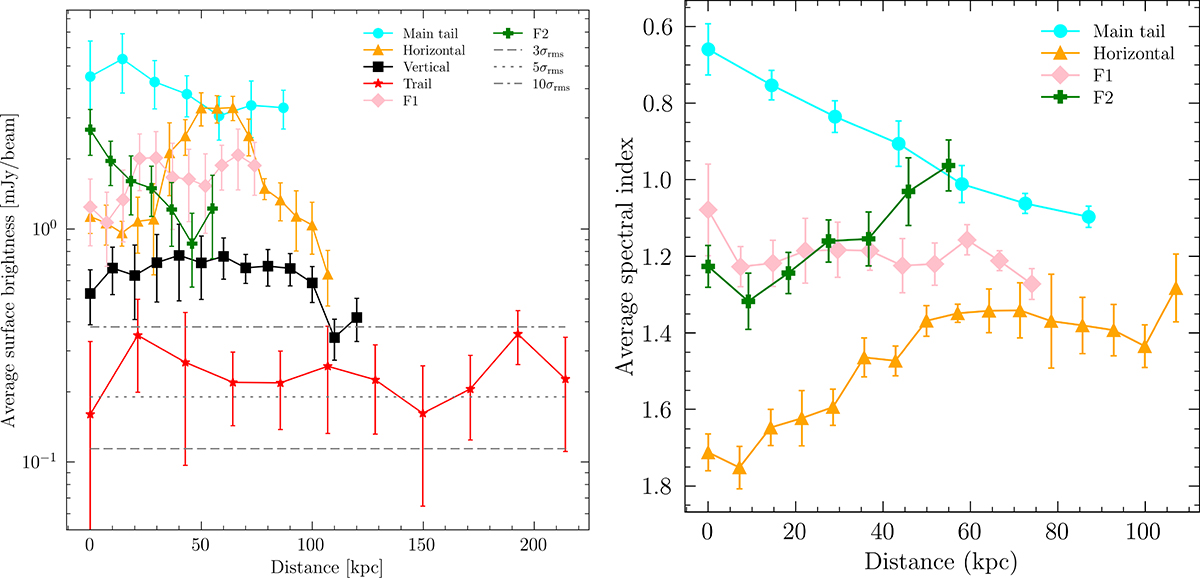
Fig. 5.
Download original image
Surface brightness and spectral index trends for the Original TRG and the related filaments. The regions used to evaluate the average surface brightness and spectral index, with different color corresponding to different features, are shown in Fig. D.1, as well as the arrows that indicate the direction of the trends. These are the main tail (cyan), the horizontal (orange) and vertical (black) filaments, F1 (pink), F2 (green), and the Trail (red). Left: Average surface brightness trends along the features’ extension at 144 MHz. Right: Average spectral index trends along the features’ extension, considering only pixels above a 3σrms threshold. The spectral index is not shown for the vertical filament and for the Trail given the lack of enough pixels above the chosen threshold.
Current usage metrics show cumulative count of Article Views (full-text article views including HTML views, PDF and ePub downloads, according to the available data) and Abstracts Views on Vision4Press platform.
Data correspond to usage on the plateform after 2015. The current usage metrics is available 48-96 hours after online publication and is updated daily on week days.
Initial download of the metrics may take a while.