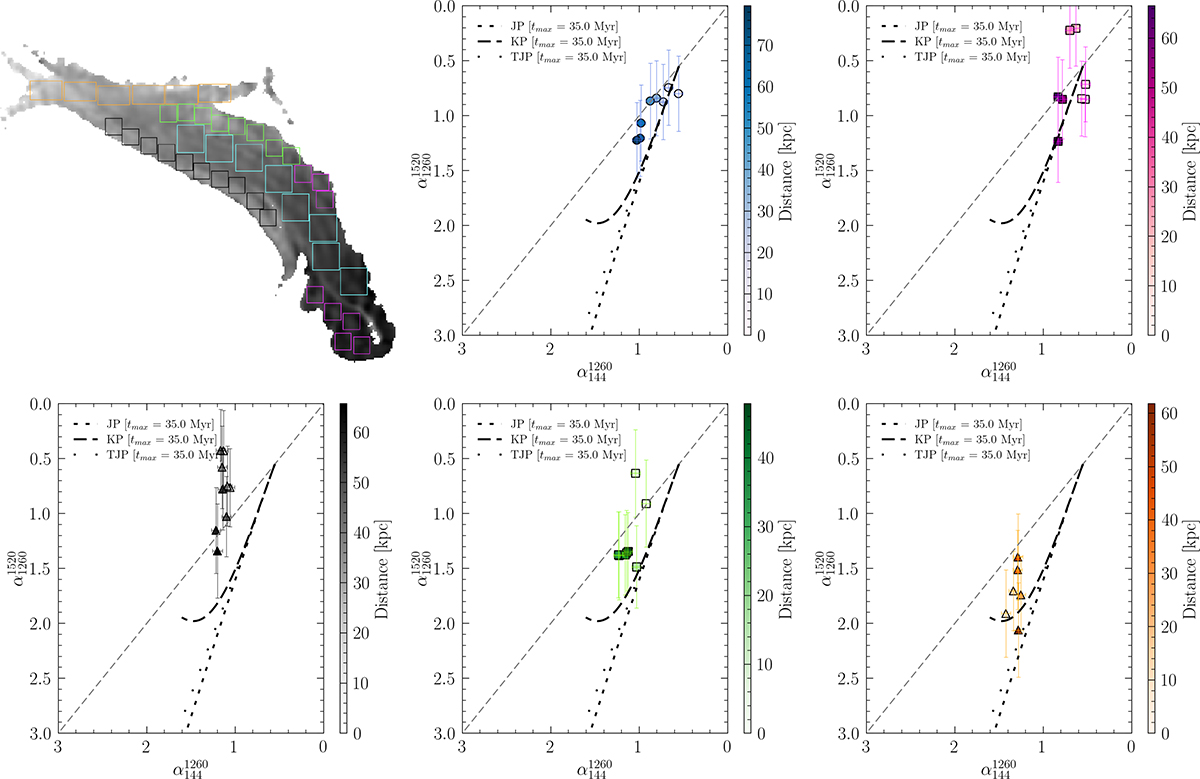
Fig. 6.
Download original image
Color-color diagrams for different regions in the Original TRG. Main tail (blue), southern tail (magenta), F1 (black), F2 (green), horizontal filament (orange) are shown from top to bottom, left to right. The distance is calculated between the centers of consecutive regions, starting from a reference region (Sect. 4.4), in the left-to-right direction for the horizontal filament and in the bottom-to-top direction for all the others.
Current usage metrics show cumulative count of Article Views (full-text article views including HTML views, PDF and ePub downloads, according to the available data) and Abstracts Views on Vision4Press platform.
Data correspond to usage on the plateform after 2015. The current usage metrics is available 48-96 hours after online publication and is updated daily on week days.
Initial download of the metrics may take a while.