Open Access
Fig. 2
Download original image
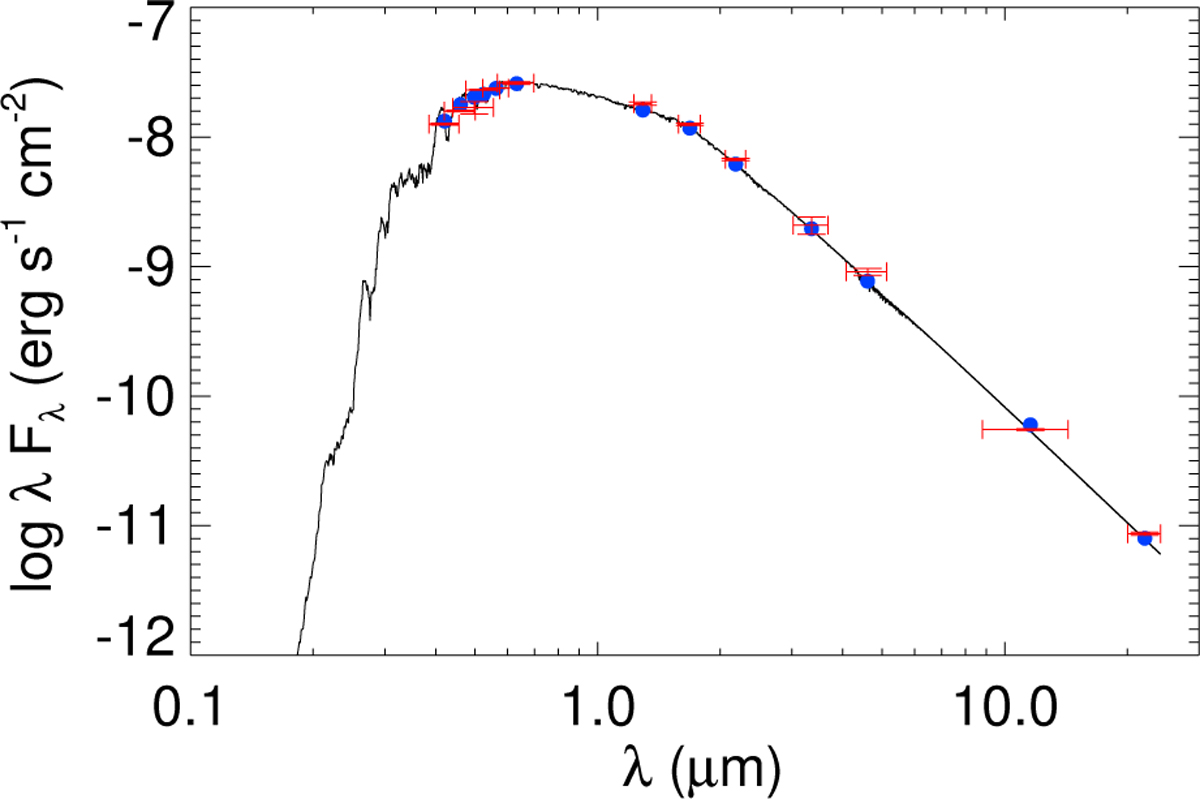
Stellar spectral energy distribution. The broadband measurements from the Tycho, APASS Johnson and Sloan, 2MASS and WISE magnitudes are shown in red, and the corresponding theoretical values with blue circles. The solid black line displays the non-averaged best-fit model.
Current usage metrics show cumulative count of Article Views (full-text article views including HTML views, PDF and ePub downloads, according to the available data) and Abstracts Views on Vision4Press platform.
Data correspond to usage on the plateform after 2015. The current usage metrics is available 48-96 hours after online publication and is updated daily on week days.
Initial download of the metrics may take a while.