Fig. D.1
Download original image
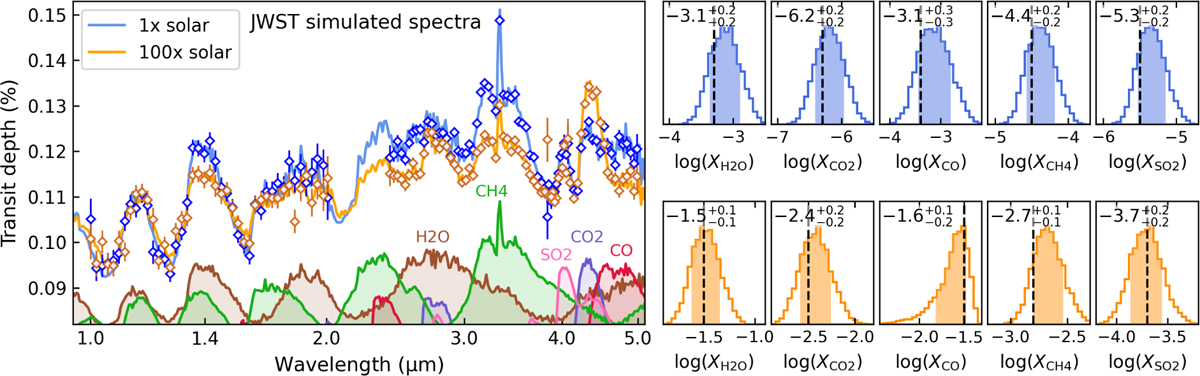
Left: Simulated JWST transmission spectra of TOI-5789 c (top panels) for atmosphere scenarios at 1× (blue) and 100× (orange) solar metallicities. The diamond markers with error bars denote the simulated NIRCam observations, which probe the 1.0–5.0 μm range (F150W2, F322W2, and F444W). The lower part of the panel shows the scaled contributions of different molecules. Right: Retrieved posterior distributions for the VMRs of the molecules expected to shape the transmission spectrum (same color coding as before). The shaded areas denote the 1σ uncertainty. The values report the median and 1σ span of the posteriors. The black dashed lines denote the VMRs of the underlying true models.
Current usage metrics show cumulative count of Article Views (full-text article views including HTML views, PDF and ePub downloads, according to the available data) and Abstracts Views on Vision4Press platform.
Data correspond to usage on the plateform after 2015. The current usage metrics is available 48-96 hours after online publication and is updated daily on week days.
Initial download of the metrics may take a while.