Fig. D.2
Download original image
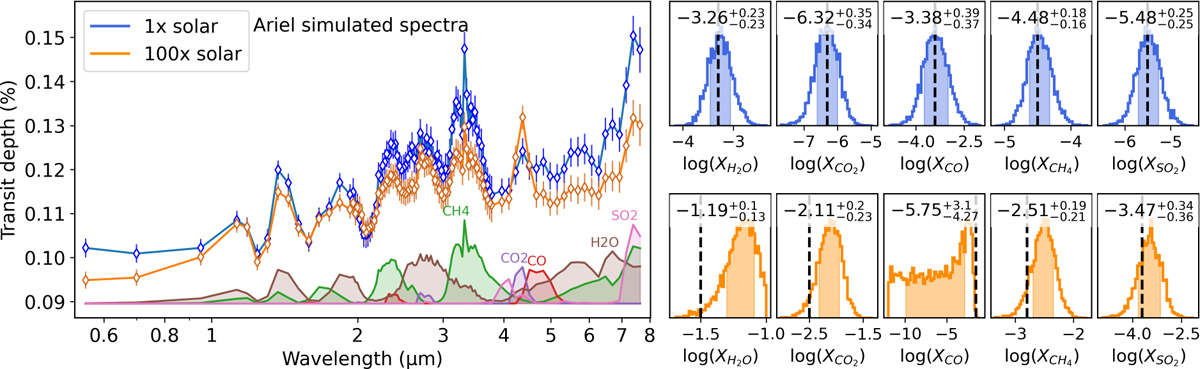
Left: Simulated spectra of TOI-5789 at Ariel’s Tier-3 resolution, assuming 1× (blue) and 100× (orange) solar metallicities. The lower part of the panel shows the scaled contributions of different molecules. Right: Retrieved chemical abundances. The dashed vertical lines indicate the true values for each species, while the colored regions of the histograms represent the 15.86%-84.14% quantiles of the posterior distributions.
Current usage metrics show cumulative count of Article Views (full-text article views including HTML views, PDF and ePub downloads, according to the available data) and Abstracts Views on Vision4Press platform.
Data correspond to usage on the plateform after 2015. The current usage metrics is available 48-96 hours after online publication and is updated daily on week days.
Initial download of the metrics may take a while.