Fig. 4
Download original image
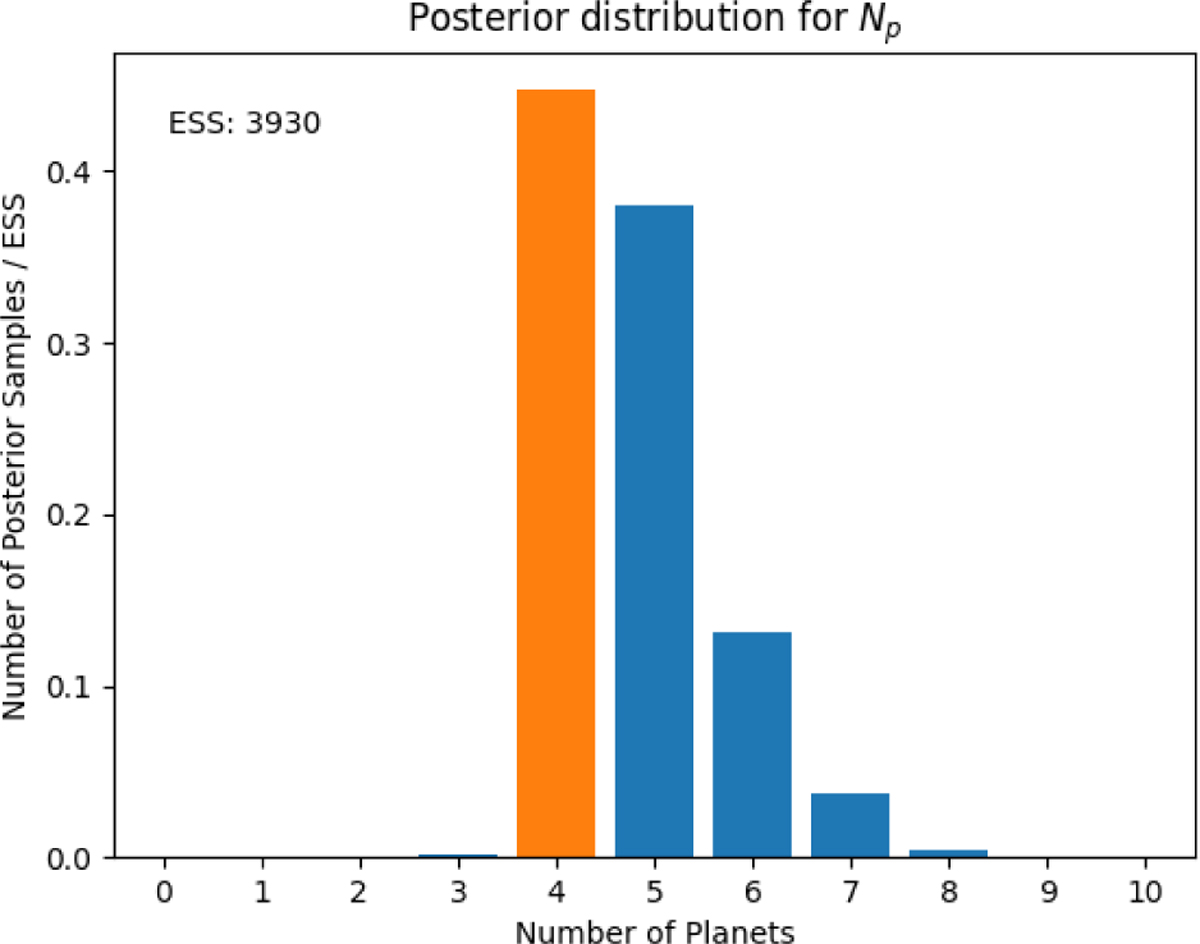
Posterior distribution of the number of planets Np detected with kima in the HARPS-N radial velocities. The distributions are shown as the number of posterior samples for each value of Np normalized to the effective sample size (ESS). The orange bar highlights the highest value for Np =4 corresponding to the most likely 4-planet model.
Current usage metrics show cumulative count of Article Views (full-text article views including HTML views, PDF and ePub downloads, according to the available data) and Abstracts Views on Vision4Press platform.
Data correspond to usage on the plateform after 2015. The current usage metrics is available 48-96 hours after online publication and is updated daily on week days.
Initial download of the metrics may take a while.