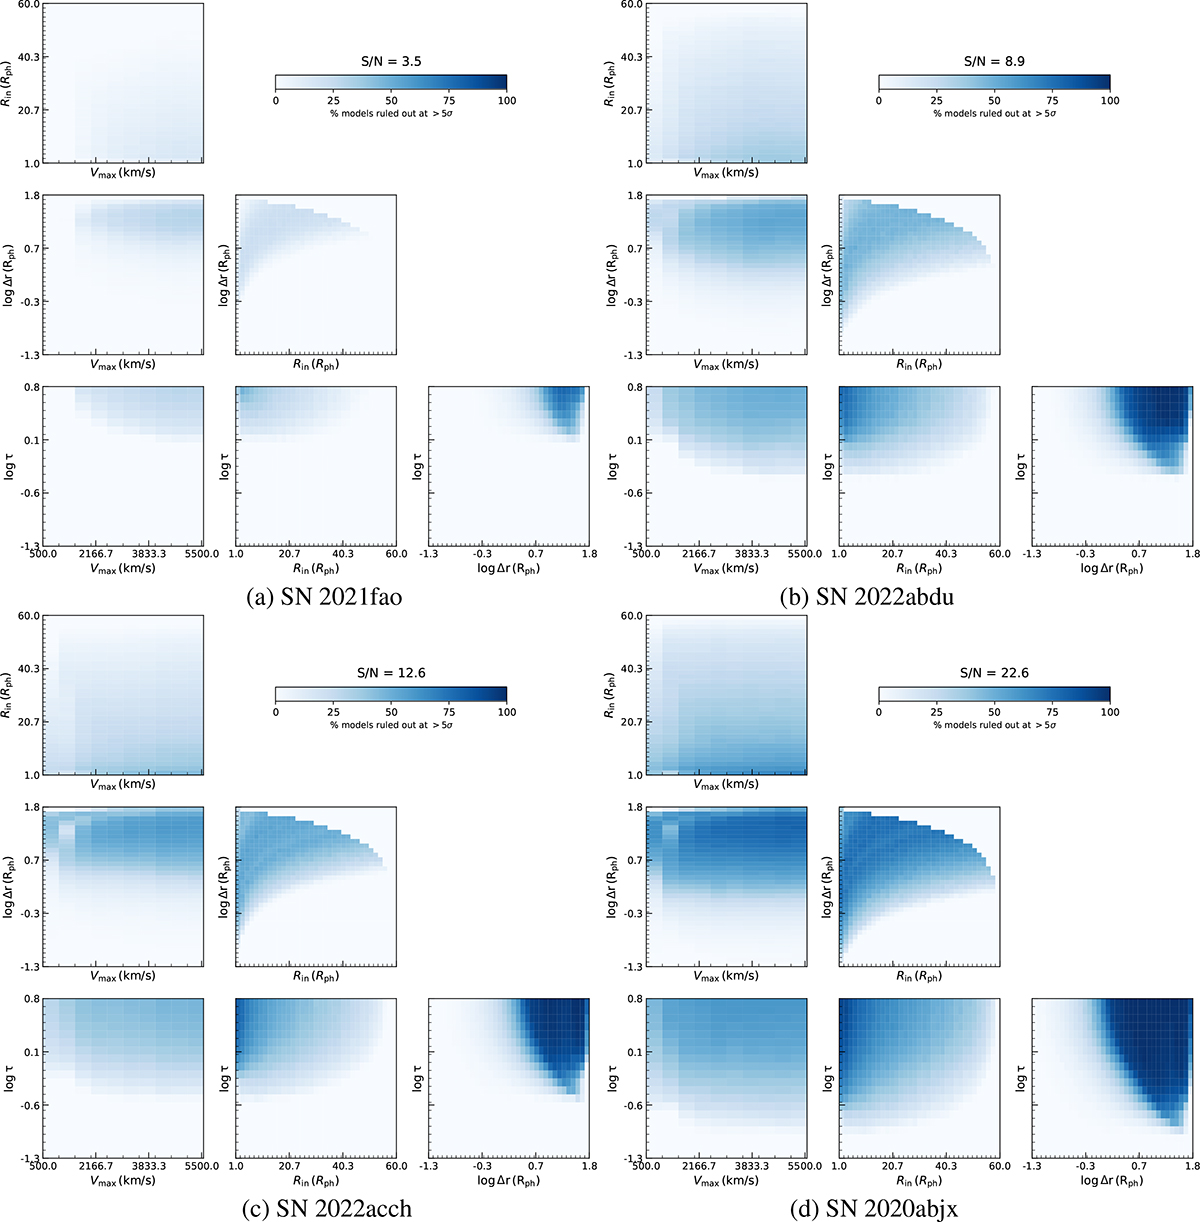
Fig. 3.
Download original image
Corner plots for four of the 16 events in our sample without CSM detections, illustrating the percentage of CSM models ruled out as a function of an increasing S/N. The colorbar indicates the fraction of excluded models. The parameters correspond to the maximum velocity vmax, inner radius Rin, shell thickness Δr and optical depth τ.
Current usage metrics show cumulative count of Article Views (full-text article views including HTML views, PDF and ePub downloads, according to the available data) and Abstracts Views on Vision4Press platform.
Data correspond to usage on the plateform after 2015. The current usage metrics is available 48-96 hours after online publication and is updated daily on week days.
Initial download of the metrics may take a while.