Fig. 4.
Download original image
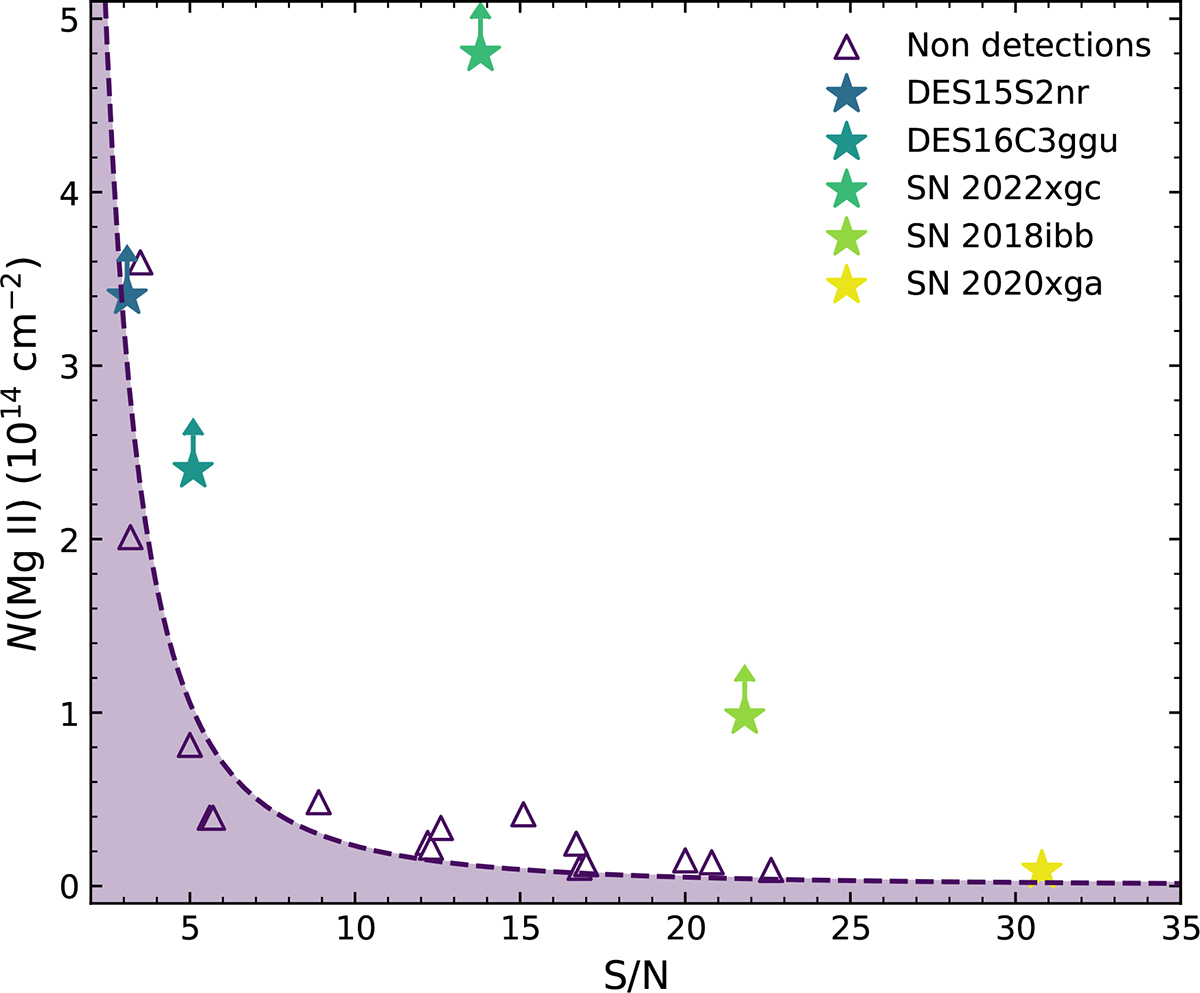
Column density of the CSM shells as a function of the spectrum’s S/N. Triangular markers denote the lower limits for objects with no detected shell, representing the column density above which a shell would have been detectable given the noise level. The dashed line shows the best-fit relation, and the shaded region marks the parameter space where a CSM shell would remain undetectable at the given S/N. Star symbols indicate the measured column densities (or lower limits) for objects with detected CSM shells.
Current usage metrics show cumulative count of Article Views (full-text article views including HTML views, PDF and ePub downloads, according to the available data) and Abstracts Views on Vision4Press platform.
Data correspond to usage on the plateform after 2015. The current usage metrics is available 48-96 hours after online publication and is updated daily on week days.
Initial download of the metrics may take a while.