Fig. 7.
Download original image
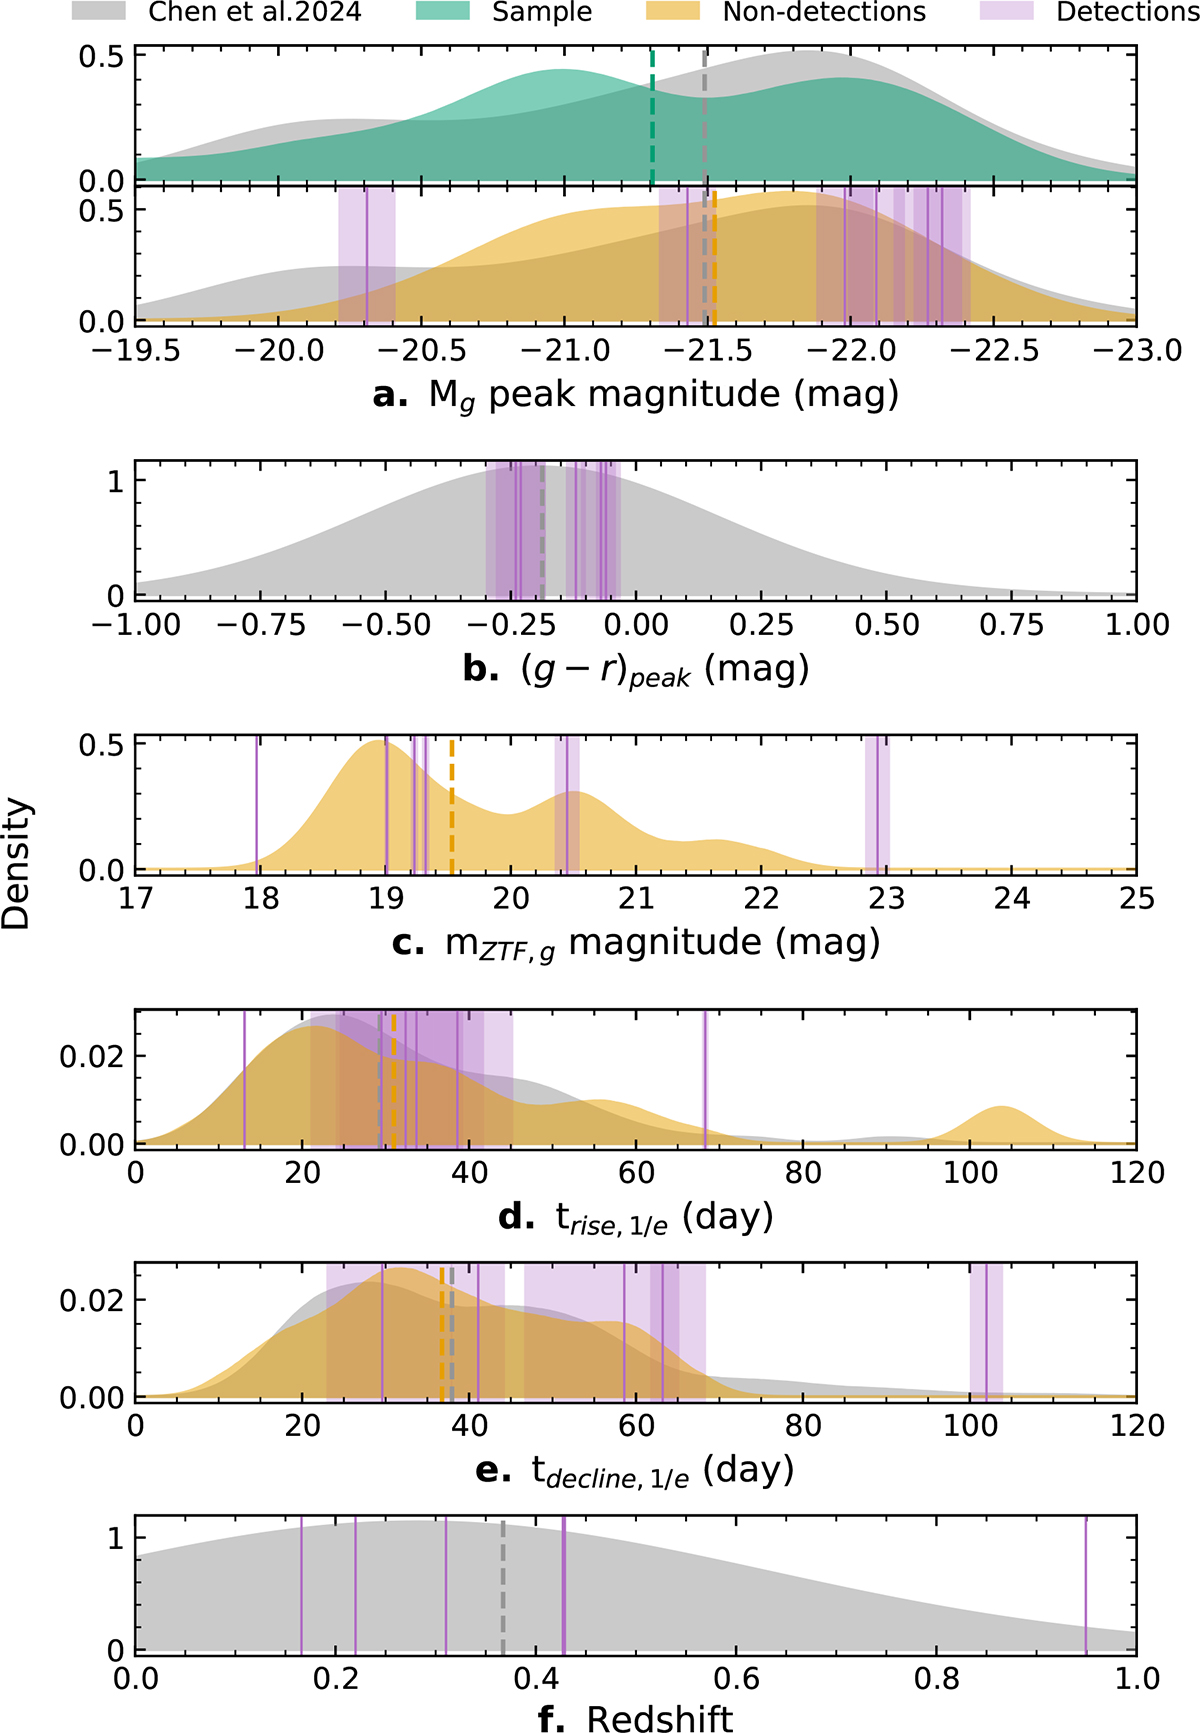
Comparison of the photometric properties of the final X-shooter sample with the ZTF SLSN-I sample from Chen et al. (2023a). Panel a (upper): KDE distributions of Mg peak magnitudes for 78 ZTF SLSNe-I and the triggered X-shooter sample. Panel a (bottom): KDE distributions of Mg peak magnitudes for the ZTF sample, with the X-shooter detections and non-detections shown separately. Panel b: KDE distribution of (g − r)peak for the ZTF sample, overlaid with individual measurements and 1σ uncertainties (purple lines and shaded regions) for the detection events. Panel c: KDE distributions of observed mg magnitudes for the non-detection subsample and individual measurements of the detection events. Panels d and e: KDE distributions of the rise and decline timescales for the ZTF and non-detection subsamples, along with individual measurements for the detection events. Panel f: KDE distribution of redshifts for the ZTF sample, with overlaid redshift values of the detection events. Vertical dashed colored lines indicate the median of each distribution.
Current usage metrics show cumulative count of Article Views (full-text article views including HTML views, PDF and ePub downloads, according to the available data) and Abstracts Views on Vision4Press platform.
Data correspond to usage on the plateform after 2015. The current usage metrics is available 48-96 hours after online publication and is updated daily on week days.
Initial download of the metrics may take a while.