Fig. 1.
Download original image
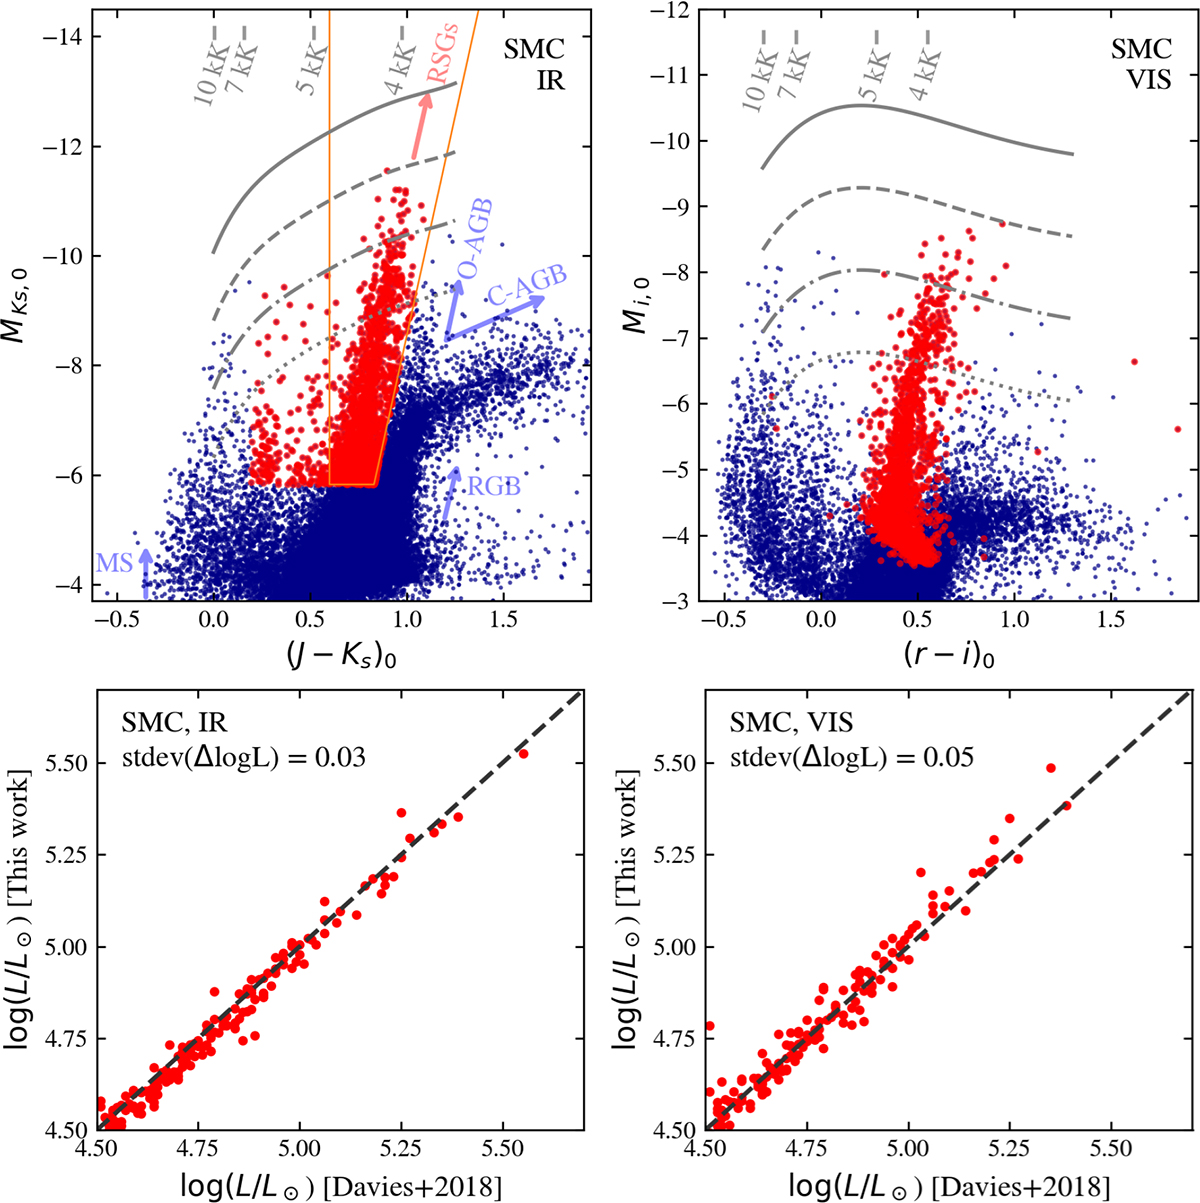
Top panels: Extinction-corrected CMDs of SMC sources, based on IR data (left) and optical VIS data (right). The orange lines indicate the RSG cuts in the IR. The red markers indicate sources classified as cool SGs, and the blue markers indicate other sources. The four gray lines represent iso-luminosity lines (Eq. (2)). These iso-luminosity lines represent log(L/L⊙) = 6.0, 5.5, 5.0, and 4.5, where the higher values are closer toward the top of the plots. At the top of each panel, gray ticks indicate the temperatures to which they correspond, according to the adopted bolometric corrections. In the top left panel, following Nally et al. (2024), the arrows parallel to various features indicate the main sequence (MS), red giant branch, oxygen (O) and carbon (C) AGB, and the RSGs. Bottom panels: Luminosities calculated in this work (both in the visual and infrared) as a function of luminosities calculated in earlier work by Davies et al. (2018). The dashed black line indicates where both luminosities would be identical.
Current usage metrics show cumulative count of Article Views (full-text article views including HTML views, PDF and ePub downloads, according to the available data) and Abstracts Views on Vision4Press platform.
Data correspond to usage on the plateform after 2015. The current usage metrics is available 48-96 hours after online publication and is updated daily on week days.
Initial download of the metrics may take a while.