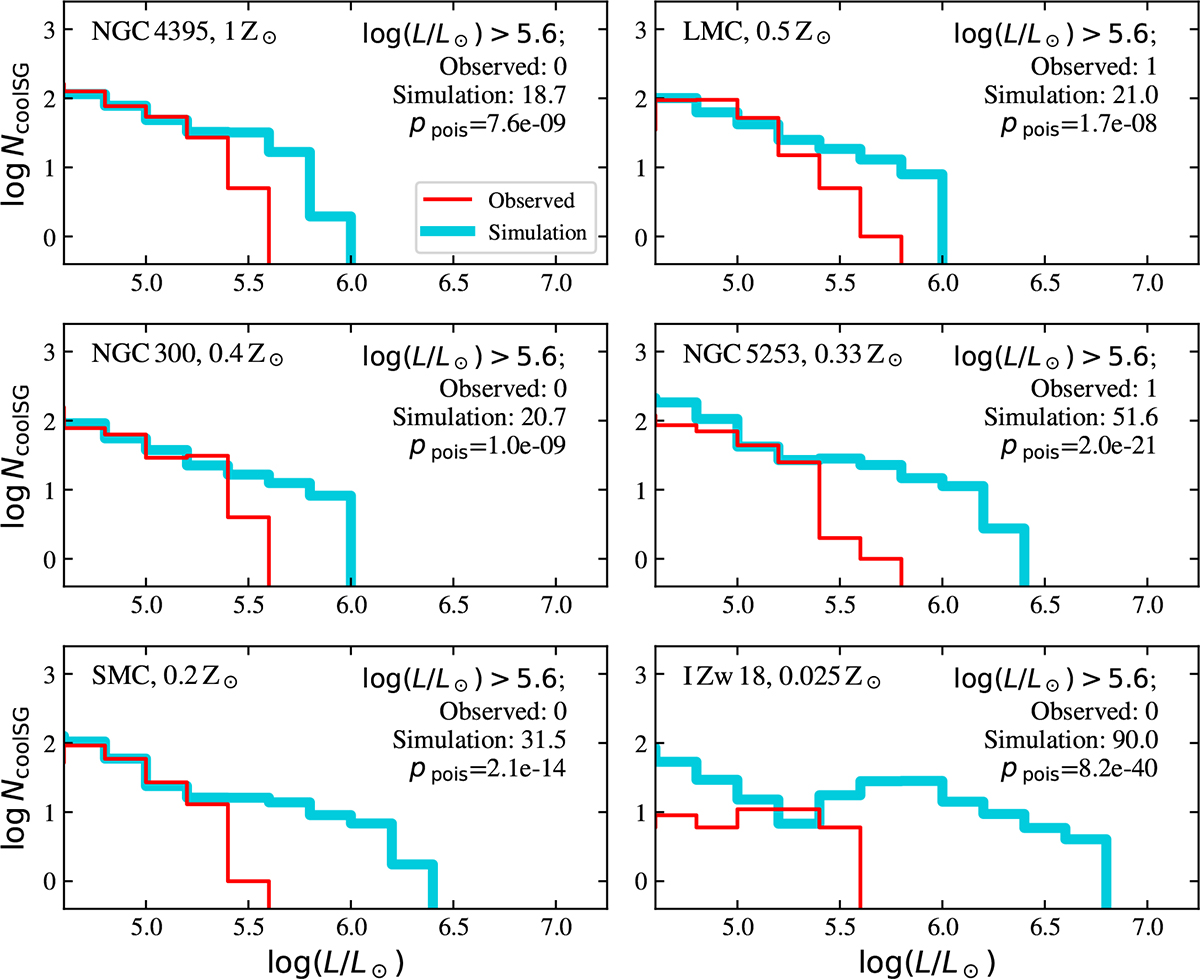
Fig. 3.
Download original image
Luminosity distributions of observed sources (red lines) and sources in the theoretical population (light blue lines) in six different galaxies. The observed SMC and LMC sources are taken from Davies et al. (2018); for the remaining sources the luminosities are derived in this work. At the right side of each panel, we list the number of observed and model population sources with log(L/L⊙) > 5.6, along with the associated Poisson probability of having this many or fewer observed sources (given the theoretically predicted number).
Current usage metrics show cumulative count of Article Views (full-text article views including HTML views, PDF and ePub downloads, according to the available data) and Abstracts Views on Vision4Press platform.
Data correspond to usage on the plateform after 2015. The current usage metrics is available 48-96 hours after online publication and is updated daily on week days.
Initial download of the metrics may take a while.