Fig. 5.
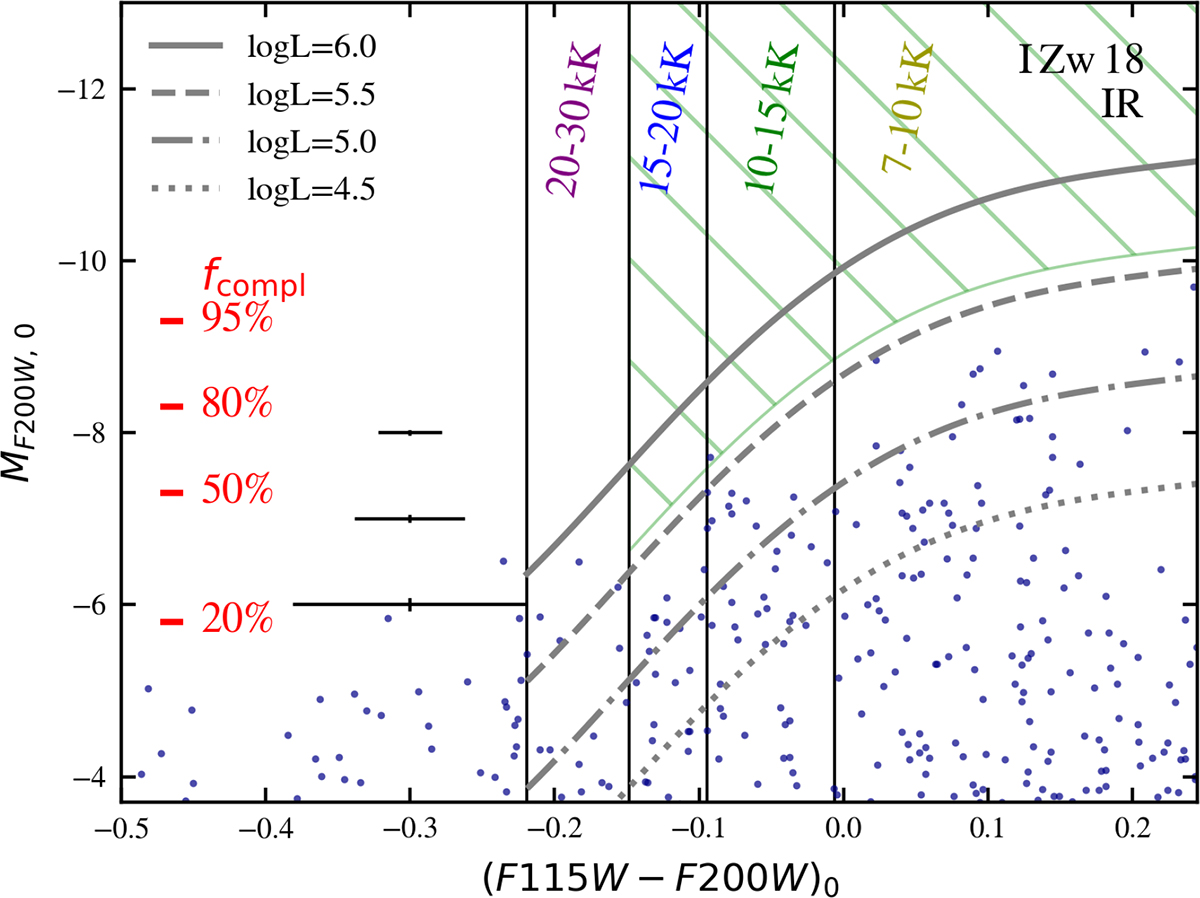
Download original image
Similar to the bottom left panel of Fig. 2, but showing only the infrared data of I Zw 18 and zoomed in on the bluer side of the CMD. Here, we show iso-luminosity lines extending to bluer colors. The temperature ranges associated with the color intervals bordered by the vertical black lines are listed in the plot. The green hatching highlights the empty region associated with Teff < 20 kK and log(L/L⊙) > 5.6. The red ticks indicate the absolute F200W magnitudes at which Bortolini et al. (2024) find a completeness (fcompl) of 20%, 50%, 80%, and 95% in the densest region of I Zw 18, R1. With black crosses we show typical observational errors from Bortolini et al. (2024) at absolute F115W magnitudes of −8, −7, and −6, also estimated for R1.
Current usage metrics show cumulative count of Article Views (full-text article views including HTML views, PDF and ePub downloads, according to the available data) and Abstracts Views on Vision4Press platform.
Data correspond to usage on the plateform after 2015. The current usage metrics is available 48-96 hours after online publication and is updated daily on week days.
Initial download of the metrics may take a while.