Fig. 5
Download original image
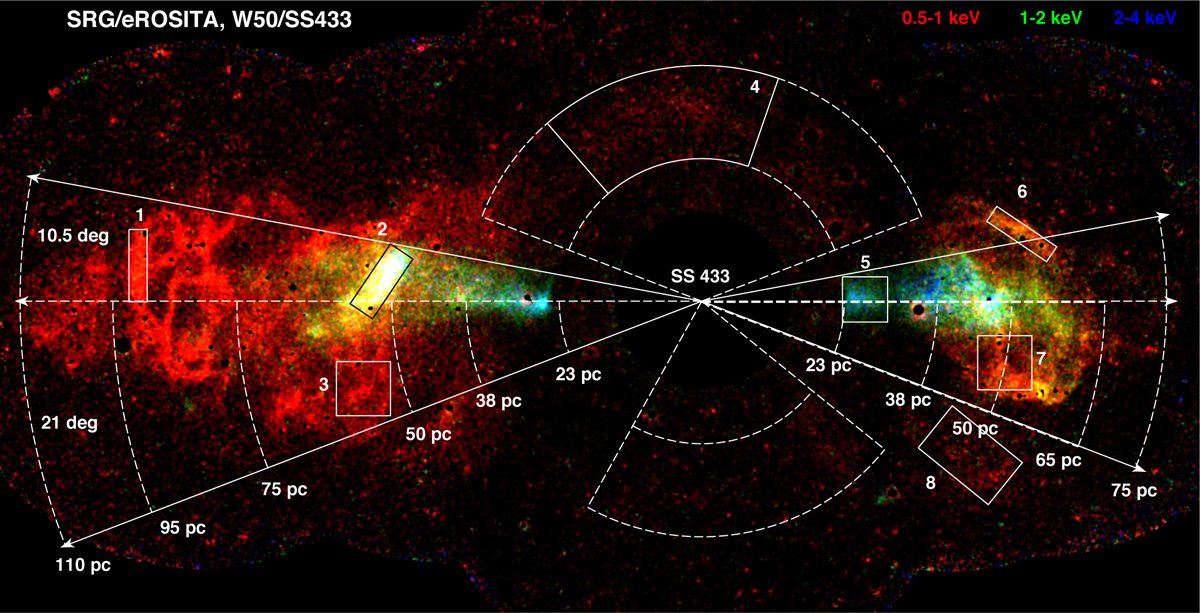
“Anatomy” of diffuse X-ray emission inside W50. The image shows a composite map of the X-ray surface brightness in 0.5−1,1−2, and 2−4 keV energy bands (similar to Fig. 3) after masking bright foreground and background point sources, and the central source SS 433. Overlaid in white are markers of the distance from the central source (assuming dSS 433=5 kpc) and angle with respect to its orbital plane axis, coinciding with the precession axis of its narrow relativistic jets. The box regions, numbered from 1 to 6, are used for spectrum extraction and represent fiducial spectral components composing the image.
Current usage metrics show cumulative count of Article Views (full-text article views including HTML views, PDF and ePub downloads, according to the available data) and Abstracts Views on Vision4Press platform.
Data correspond to usage on the plateform after 2015. The current usage metrics is available 48-96 hours after online publication and is updated daily on week days.
Initial download of the metrics may take a while.