Fig. 7
Download original image
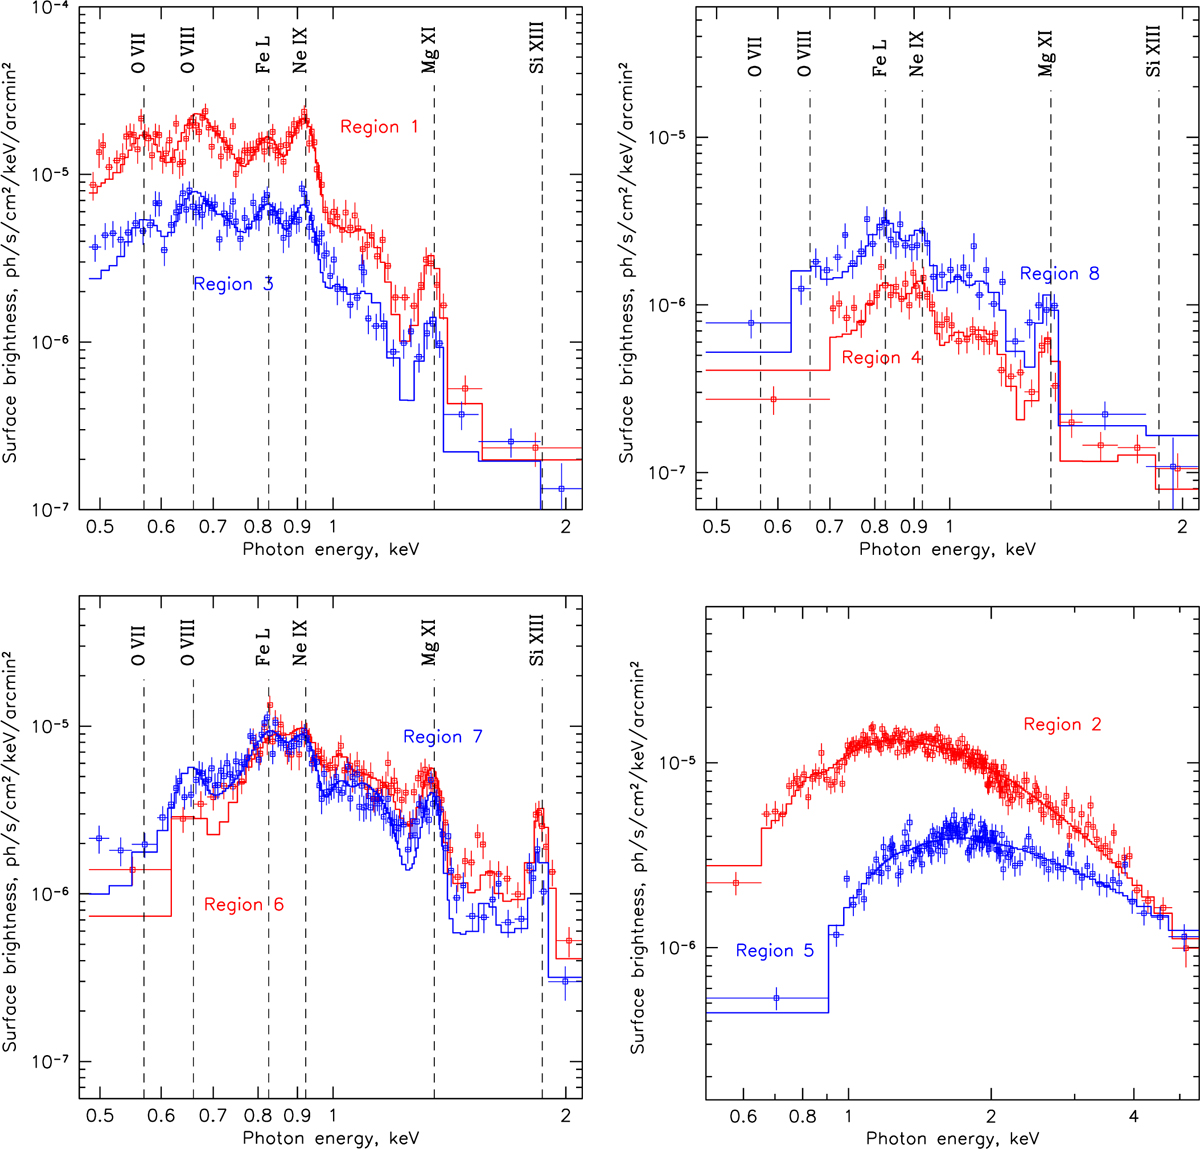
Results of spectral analysis for the data from eight representative regions. Top row: Left panel shows background-subtracted spectra of the brightest X-ray filament (Region 1 in Figure 5, red points with 1 σ error bars) and the diffuse emission (Region 3, blue points) in the eastern lobe. The right panel shows spectra of the northern Arc (Region 4, red points) and of the southern extension (Region 8, blue points). Bottom row: Left panel shows spectra of the diffuse emission in the western lobe (Region 7 in Figure 5, blue points) and of the brightest filament in the western lobe (Region 6, red points). Right panel shows spectra for the termination region of the eastern EXJ (Region 2, red points) and the base of the western jet (Region 5, blue points).
Current usage metrics show cumulative count of Article Views (full-text article views including HTML views, PDF and ePub downloads, according to the available data) and Abstracts Views on Vision4Press platform.
Data correspond to usage on the plateform after 2015. The current usage metrics is available 48-96 hours after online publication and is updated daily on week days.
Initial download of the metrics may take a while.