Fig. C.1
Download original image
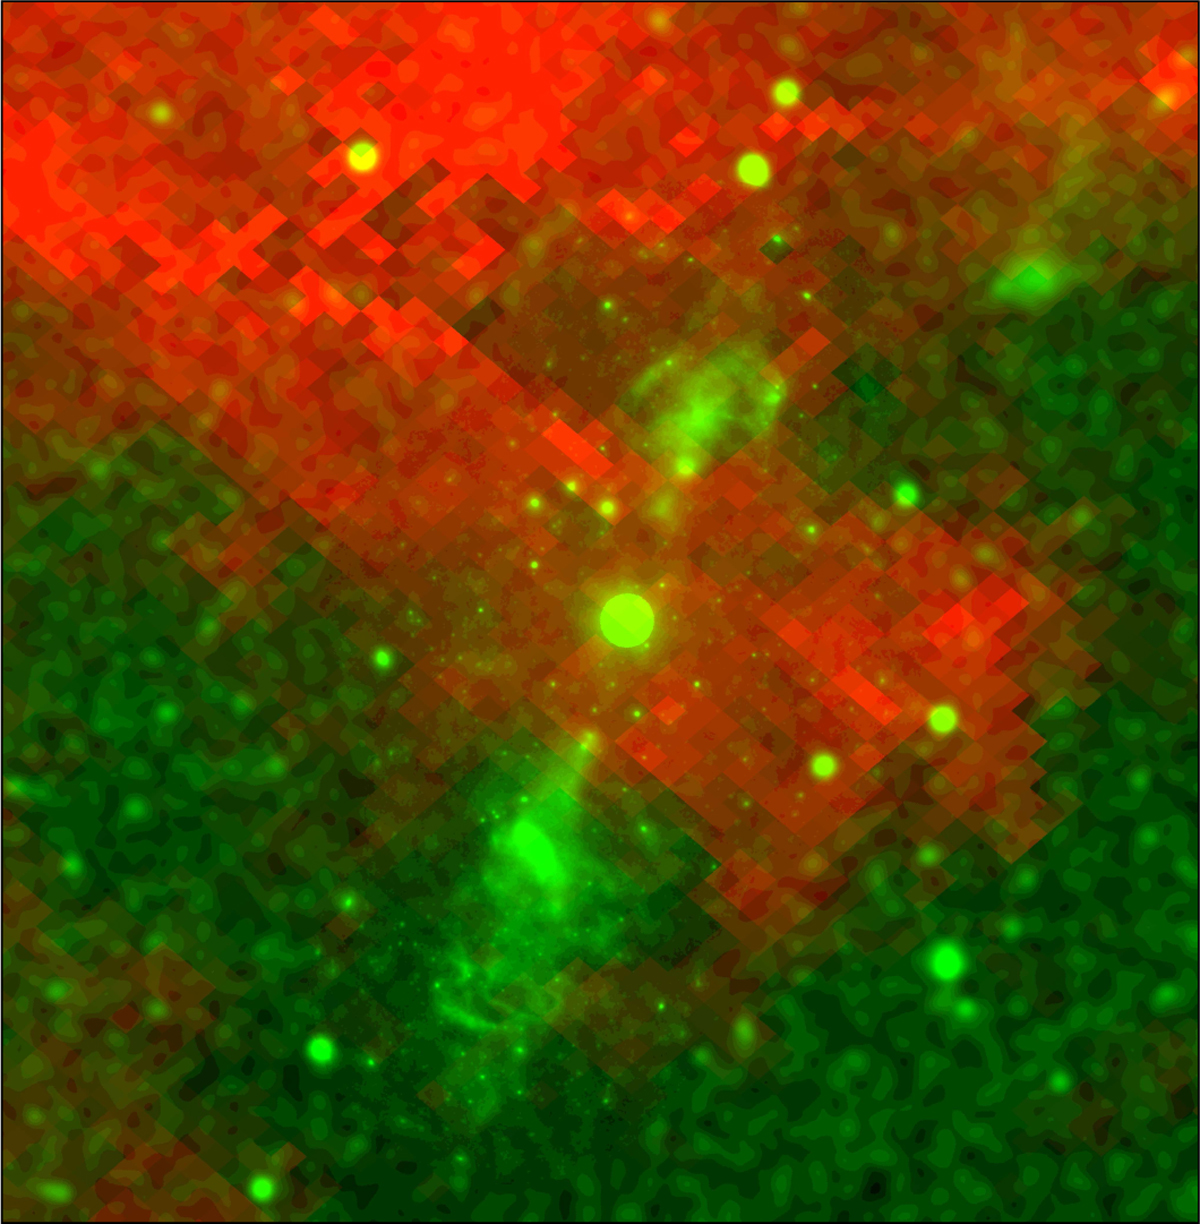
X-ray map of W50 in Galactic coordinates with the extinction map (in red) superposed. The extinction is estimated from the Bayestar 19 3D maps Green et al. (2019) up to a distance of 3 kpc from the Sun, i.e., conservatively in the foreground to W50. The extinction (AV) values range between ∼ 5 and ∼ 10 in regions overlapping with the central quasi-spherical part of W50. This apparently accidental projection of the absorbing dust/gas onto W50 leads to significant suppression of the soft X-ray flux in the affected areas.
Current usage metrics show cumulative count of Article Views (full-text article views including HTML views, PDF and ePub downloads, according to the available data) and Abstracts Views on Vision4Press platform.
Data correspond to usage on the plateform after 2015. The current usage metrics is available 48-96 hours after online publication and is updated daily on week days.
Initial download of the metrics may take a while.