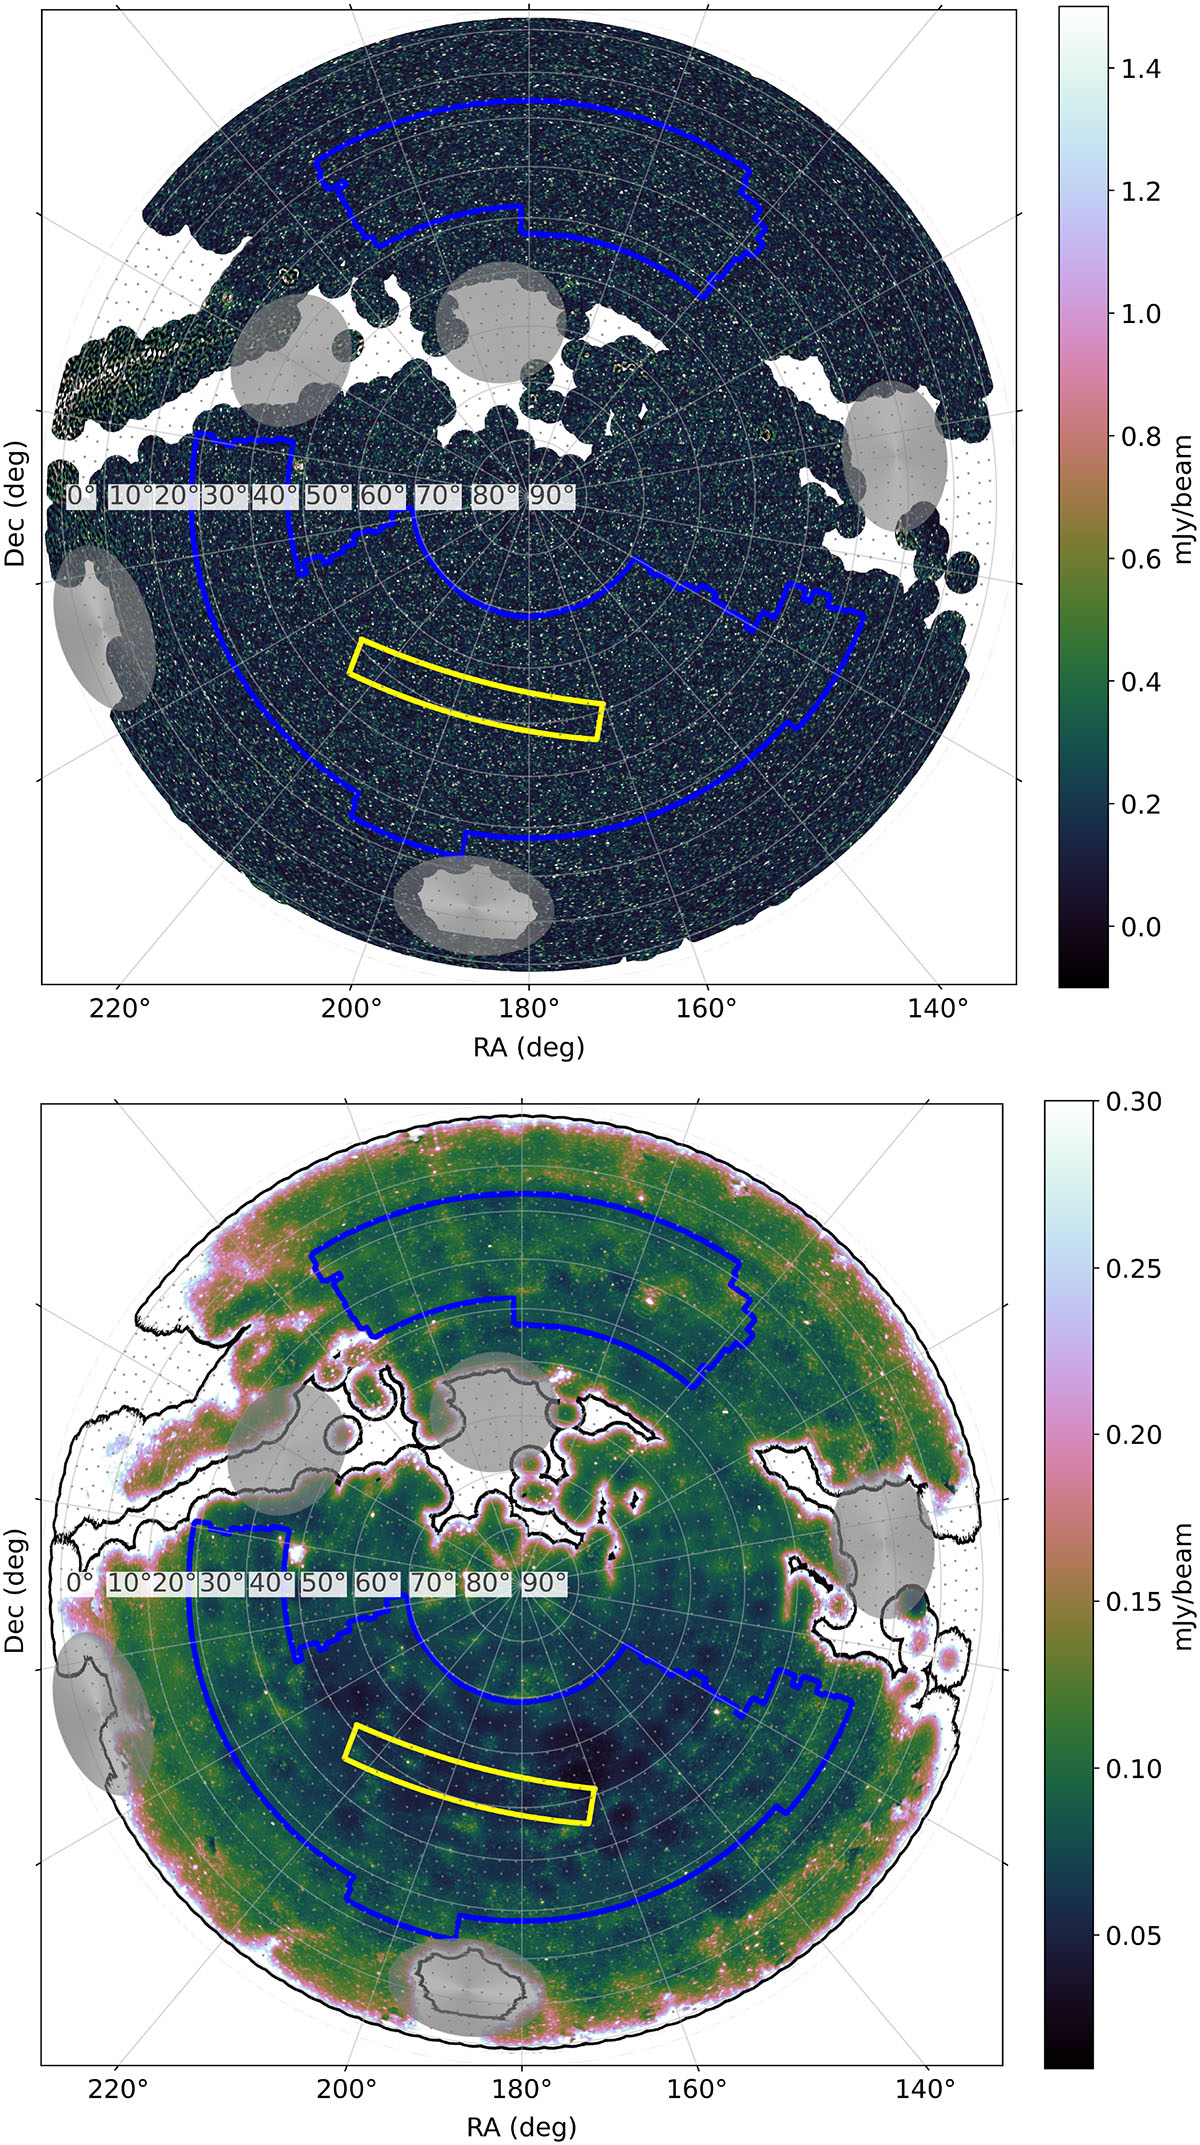
Fig. 1.
Download original image
Top: Re-projection of the LoTSS-DR3 mosaic images. Bottom: Corresponding RMS image. The yellow and blue outlines show the LoTSS-DR1 and LoTSS-DR2 areas, which cover 2% and 27% of the northern sky, respectively. The black outline in the bottom panel shows the LoTSS-DR3 coverage of 88% of the northern sky. The large grey circles show regions that are within 10° of the bright radio sources Cassiopeia A, Cygnus A, Taurus A, Hercules A, or Virgo A. The small grey dots show the locations of the 3168 LoTSS pointings of which 2551 are included in this data release.
Current usage metrics show cumulative count of Article Views (full-text article views including HTML views, PDF and ePub downloads, according to the available data) and Abstracts Views on Vision4Press platform.
Data correspond to usage on the plateform after 2015. The current usage metrics is available 48-96 hours after online publication and is updated daily on week days.
Initial download of the metrics may take a while.