Fig. 10.
Download original image
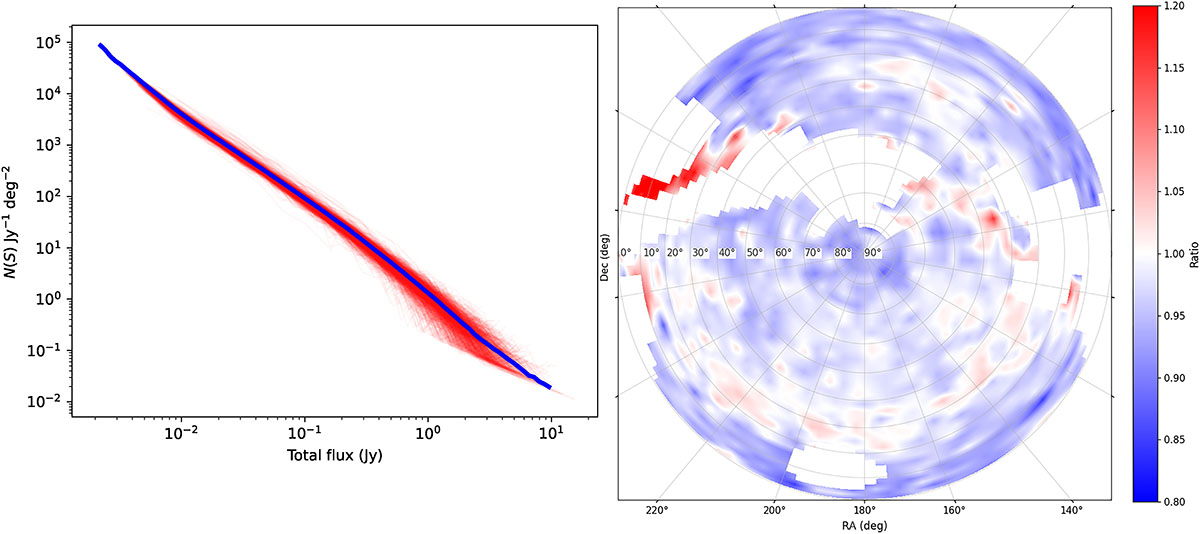
Left: Source counts for 1413 distinct HEALPix pixels with sufficient sky area for the analysis (red) with the median source counts for the whole survey overplotted (blue). Right: Correction factor for each pixel as a function of position on the sky, where blue indicates a source count plot for that region that lies below the median (lower flux density scale or fewer sources), and red indicates one that lies above it (higher flux density scale or more sources). On both plots the colour scale is linear.
Current usage metrics show cumulative count of Article Views (full-text article views including HTML views, PDF and ePub downloads, according to the available data) and Abstracts Views on Vision4Press platform.
Data correspond to usage on the plateform after 2015. The current usage metrics is available 48-96 hours after online publication and is updated daily on week days.
Initial download of the metrics may take a while.