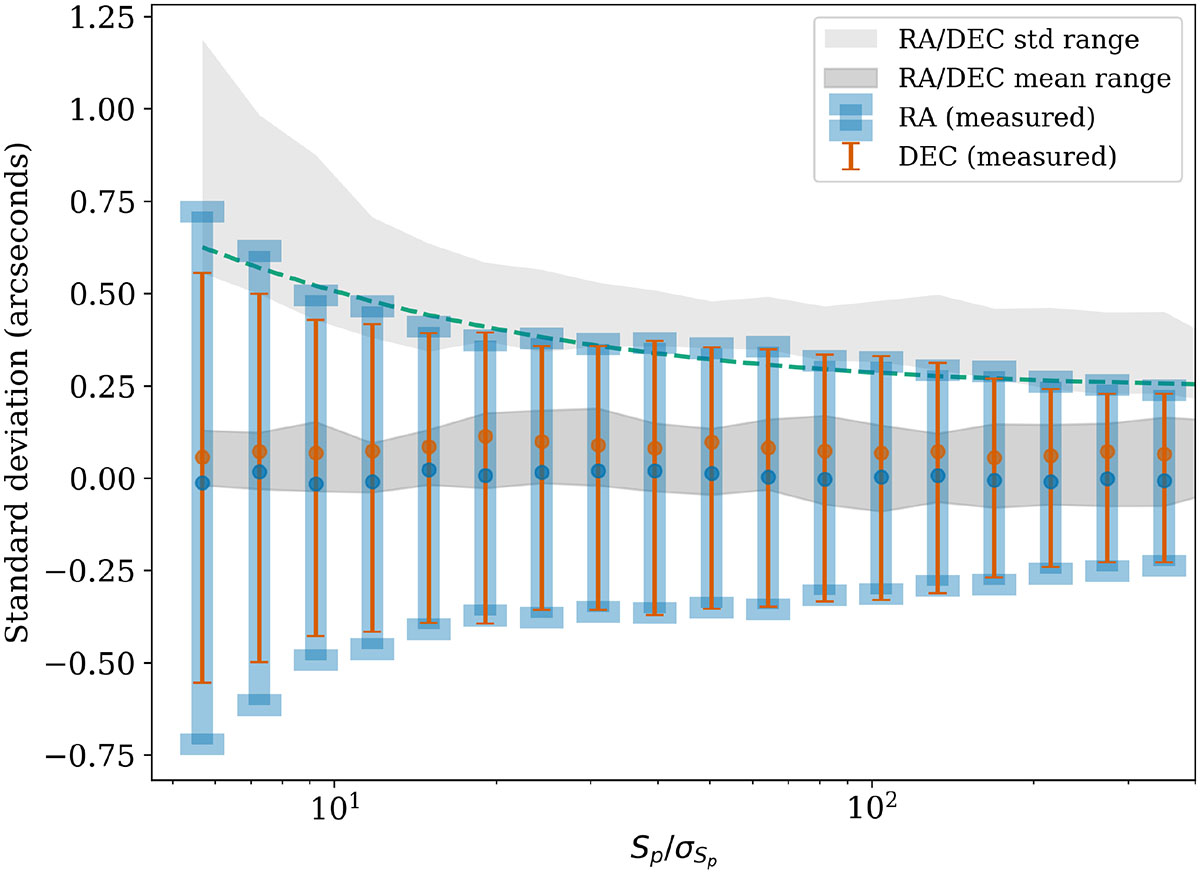
Fig. 12.
Download original image
Mean offsets (points) and corresponding standard deviations (error bars, showing ±1σ centred on zero for clarity) of RA (blue) and Dec (orange) between cross-matched LoTSS-DR3 mosaics and FIRST sources are shown as a function of LoTSS-DR3 SP/σSP for the declination range 40–50°. The green line shows the ideal standard deviations derived from modelled noise-like offsets in FIRST and LoTSS positions, including an additional systematic offset of 0.24″. The shaded light grey region shows the range of standard deviations across the full declination range of the cross-matched catalogue (−2°–65°), while the darker grey region shows the corresponding range of mean offsets.
Current usage metrics show cumulative count of Article Views (full-text article views including HTML views, PDF and ePub downloads, according to the available data) and Abstracts Views on Vision4Press platform.
Data correspond to usage on the plateform after 2015. The current usage metrics is available 48-96 hours after online publication and is updated daily on week days.
Initial download of the metrics may take a while.