Fig. 14.
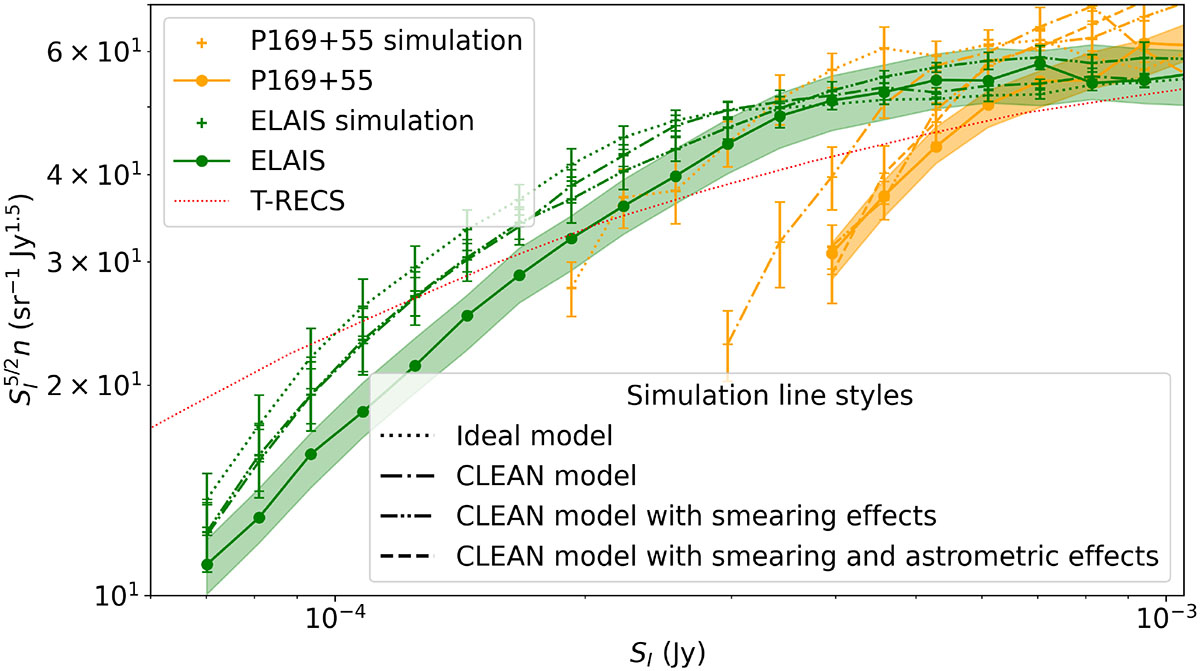
Download original image
Raw counts from a 13 square degree circular customised mosaic centred on pointing P169+55 (one of the deepest in LoTSS-DR3) and from the ELAIS-N1 LoTSS Deep field are shown as orange and green points, respectively. Shaded regions around the points indicate uncertainties due to ±6% and ±9% flux density scale errors on the LoTSS-DR3 field and ELAIS-N1, respectively. The counts from completeness simulations (see Sect. 4.3) are also plotted, with the type of simulation indicated in the legend. Error bars reflect ±1σ bootstrap uncertainties derived from the multiple runs of each simulation. Counts are shown down to the flux density where only 60% of sources are recovered in the simulations and where the area (region with a RMS of at least 5 times lower than the flux density bin) used to derive the counts exceeds a square degree. The raw measured counts are also cut according to the same level using the simulations that include both smearing and astrometric effects. In these simulations we have assumed that PYBDSF is able to recover the full integrated flux density of sources in the presence of smearing and astrometric errors. The T-RECS source counts that are injected during the simulations are shown in red.
Current usage metrics show cumulative count of Article Views (full-text article views including HTML views, PDF and ePub downloads, according to the available data) and Abstracts Views on Vision4Press platform.
Data correspond to usage on the plateform after 2015. The current usage metrics is available 48-96 hours after online publication and is updated daily on week days.
Initial download of the metrics may take a while.