Fig. 15.
Download original image
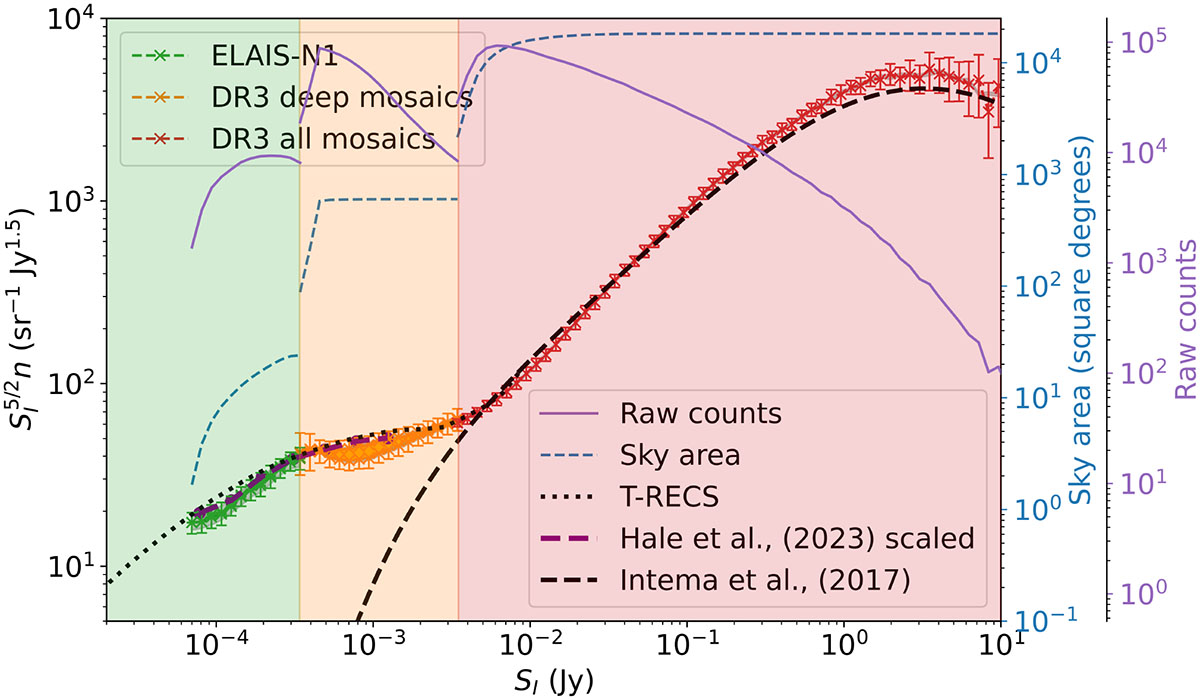
Euclidean-normalised differential source counts from the LoTSS-DR3 and the ELAIS-N1 LoTSS Deep field. Green and orange markers correspond to counts derived from ELAIS-N1 and from the 100 customised LoTSS-DR3 mosaics around the deepest pointings with completeness simulations, respectively. These counts are corrected by the fraction of sources recovered in a particular flux density bin compared to the number injected in that bin during the simulations. Counts from a mosaic region and flux density bin are only included if the simulations indicate that at least 60% of sources are recovered. Red markers show the uncorrected counts from all LoTSS-DR3 mosaics in regions where sources are detected at a significance exceeding 50. The error bars on the uncorrected LoTSS-DR3 counts are derived from splitting the northern sky into 24 regions and taking the standard deviation of the observed counts in a particular bin. The error bars on the 100 deepest LoTSS-DR3 mosaic counts are the standard deviation of the counts from the different mosaics in each bin. For ELAIS-N1 the error bars shown are the typical (14%) error bar obtained from the variation in the LoTSS-DR3 deep mosaics over the sky. The filled orange and green regions illustrate the impact of PYBDSF on recovering the integrated flux density for faint, smeared, and partially deconvolved sources in our ELAIS-N1 and 100 customised LoTSS-DR3 mosaics around the deepest pointings, respectively. The lower boundary corresponds to full recovery, while the upper boundary represents only partial recovery, proportional to the reduction in peak brightness caused by smearing and astrometric errors. The shaded grey region around the measured source counts shows the systematic flux density scale errors. For LoTSS-DR3 this uncertainty is ±2%, which is difficult to discern at the scale of the figure, while for ELAIS-N1 it is ±9%. The dashed and dotted black lines show the Intema et al. (2017) and T-RECS counts, respectively, where the Intema et al. (2017) counts are severely impacted by incompleteness below ∼5 mJy. The solid purple and dashed blue lines show the raw number of counts as well as the area used for the counts in a particular flux density bin. The Hale et al. (2023) 1.4 GHz counts for the COSMOS field with SIMBA completeness corrections and scaled by a spectral index of −0.6 are shown in dashed purple.
Current usage metrics show cumulative count of Article Views (full-text article views including HTML views, PDF and ePub downloads, according to the available data) and Abstracts Views on Vision4Press platform.
Data correspond to usage on the plateform after 2015. The current usage metrics is available 48-96 hours after online publication and is updated daily on week days.
Initial download of the metrics may take a while.