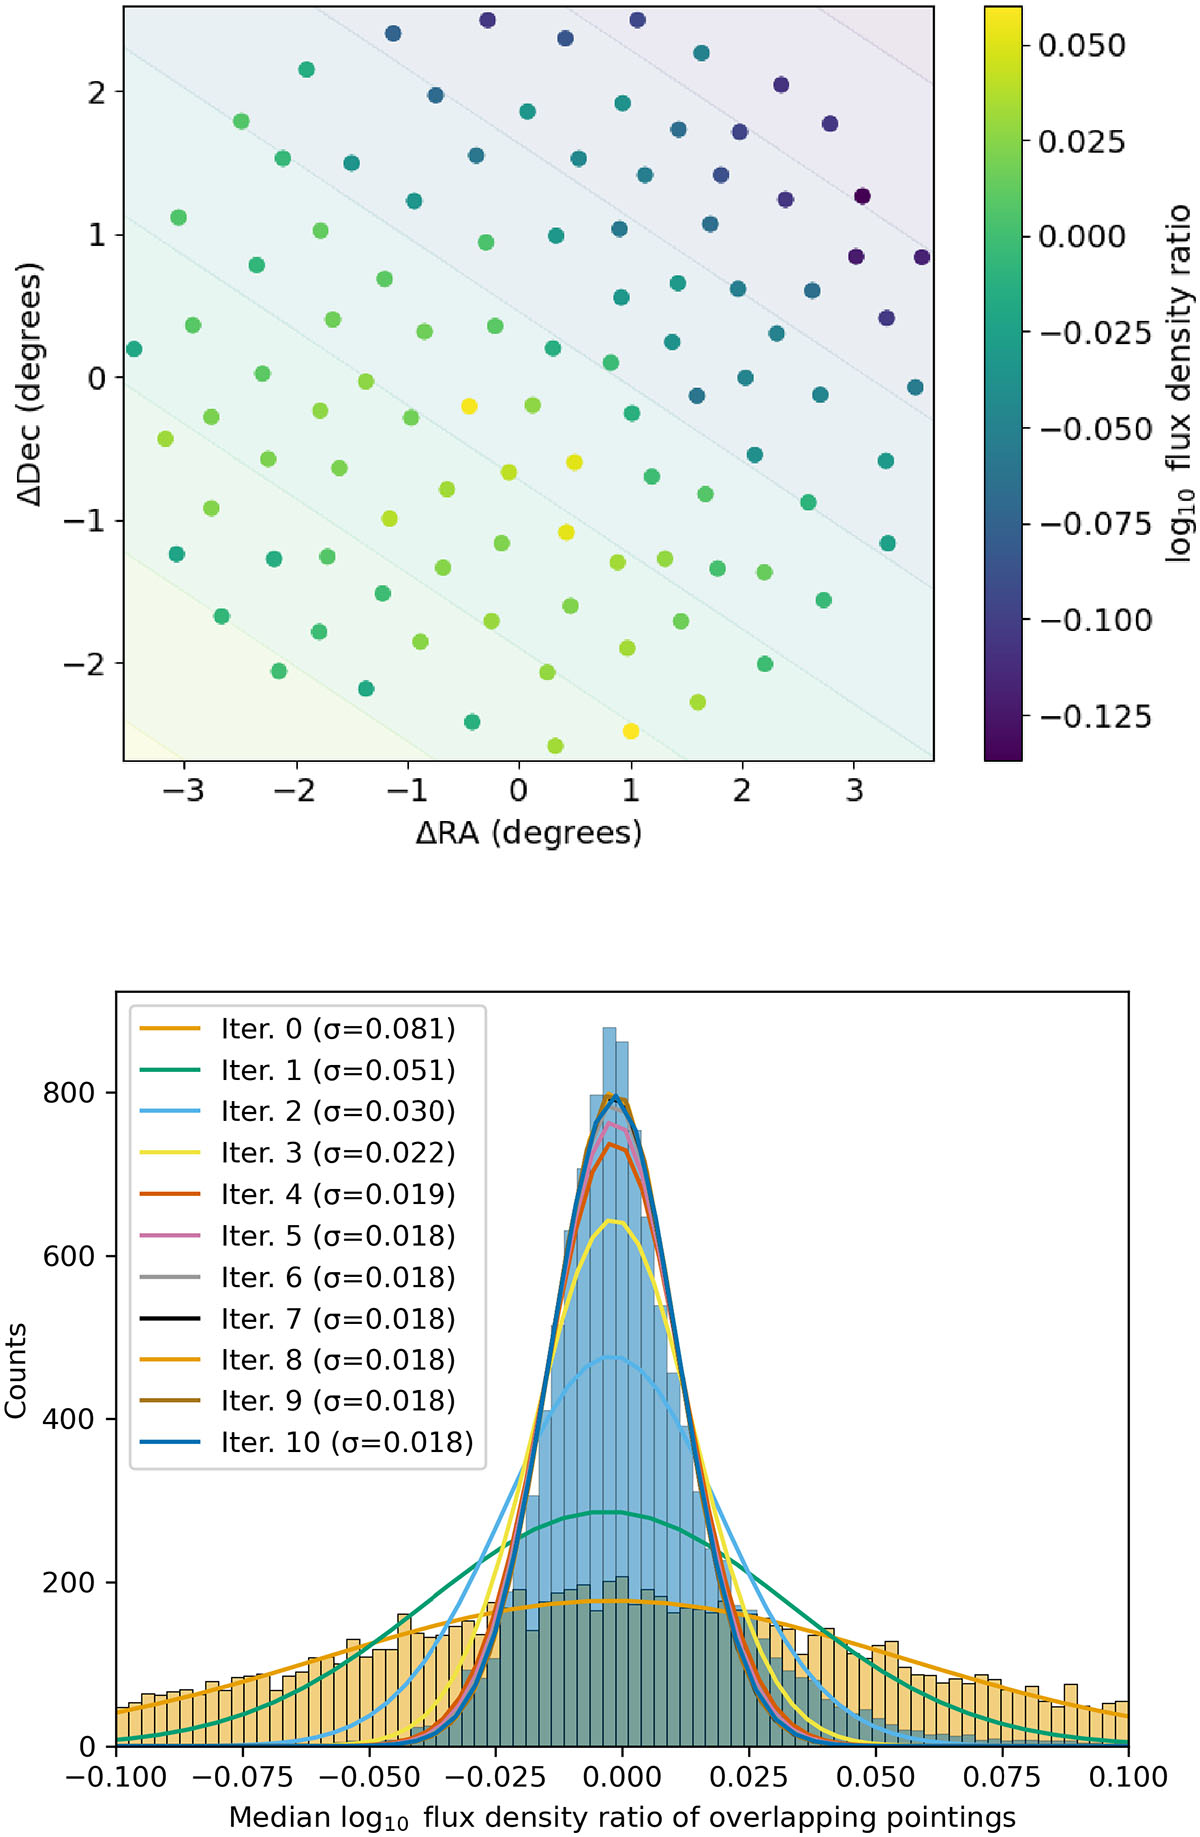
Fig. 4.
Download original image
Flux density scale alignment of LoTSS-DR3. Top: Median ratio of the catalogued integrated flux density between pointing P028+41 and the neighbouring fields before any correction to the flux density scale has been applied. The colour background shows the plane fit to the integrated flux density ratios that we use to align this pointing with the neighbouring fields. The colour bar corresponds to both the points and the background. Bottom: How the distribution of the median integrated flux density scale ratio changes as different iterations of the alignment corrections are progressively applied. The standard deviations of the fitted Gaussian functions are displayed in the legend.
Current usage metrics show cumulative count of Article Views (full-text article views including HTML views, PDF and ePub downloads, according to the available data) and Abstracts Views on Vision4Press platform.
Data correspond to usage on the plateform after 2015. The current usage metrics is available 48-96 hours after online publication and is updated daily on week days.
Initial download of the metrics may take a while.