Fig. 5.
Download original image
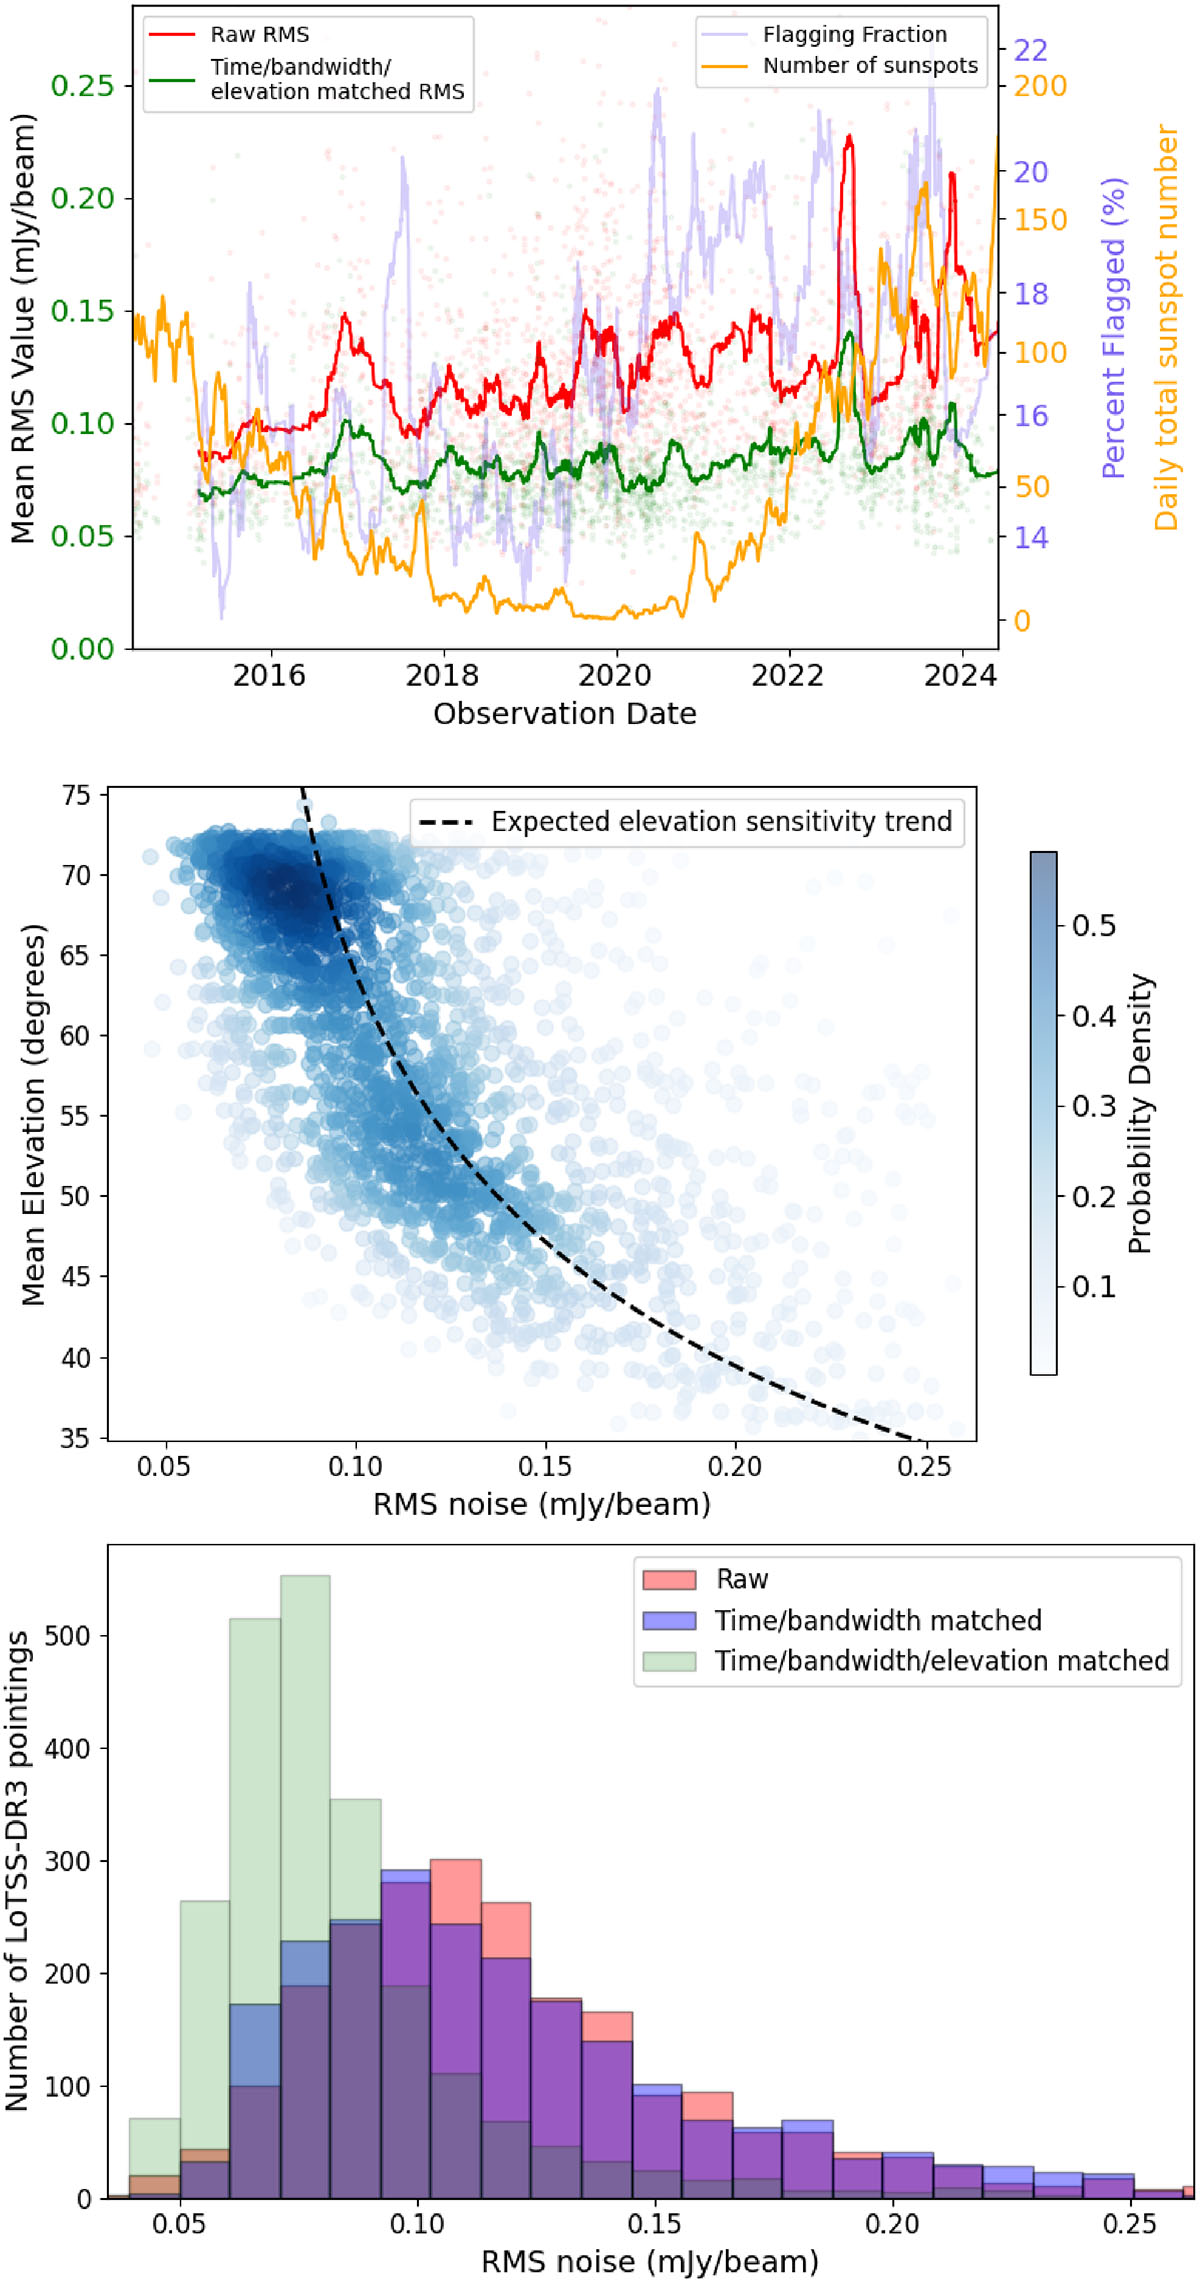
Top: Individual pointing ‘matched RMS’ as a function of observation date (green) together with the raw RMS measured from the images. The ‘matched RMS’ is the raw RMS adjusted to account for observation elevation, duration and bandwidth differences; it is scaled to match an 8 h 231 sub-band observation at optimal elevation  , where ϵ is the elevation, F is the fraction flagged, T is the observation duration in hours, and NSB is the number of sub-bands. Also plotted is the flagging fraction and the daily total number of sunspots (Clette & Lefèvre 2015) which gives an indication of the solar activity throughout the observing range. Middle: RMS adjusted to account for observation duration and bandwidth demonstrating that the expected elevation dependence is observed. Bottom: Histogram of the raw and matched RMS values.
Current usage metrics show cumulative count of Article Views (full-text article views including HTML views, PDF and ePub downloads, according to the available data) and Abstracts Views on Vision4Press platform.
Data correspond to usage on the plateform after 2015. The current usage metrics is available 48-96 hours after online publication and is updated daily on week days.
Initial download of the metrics may take a while.