Fig. 8.
Download original image
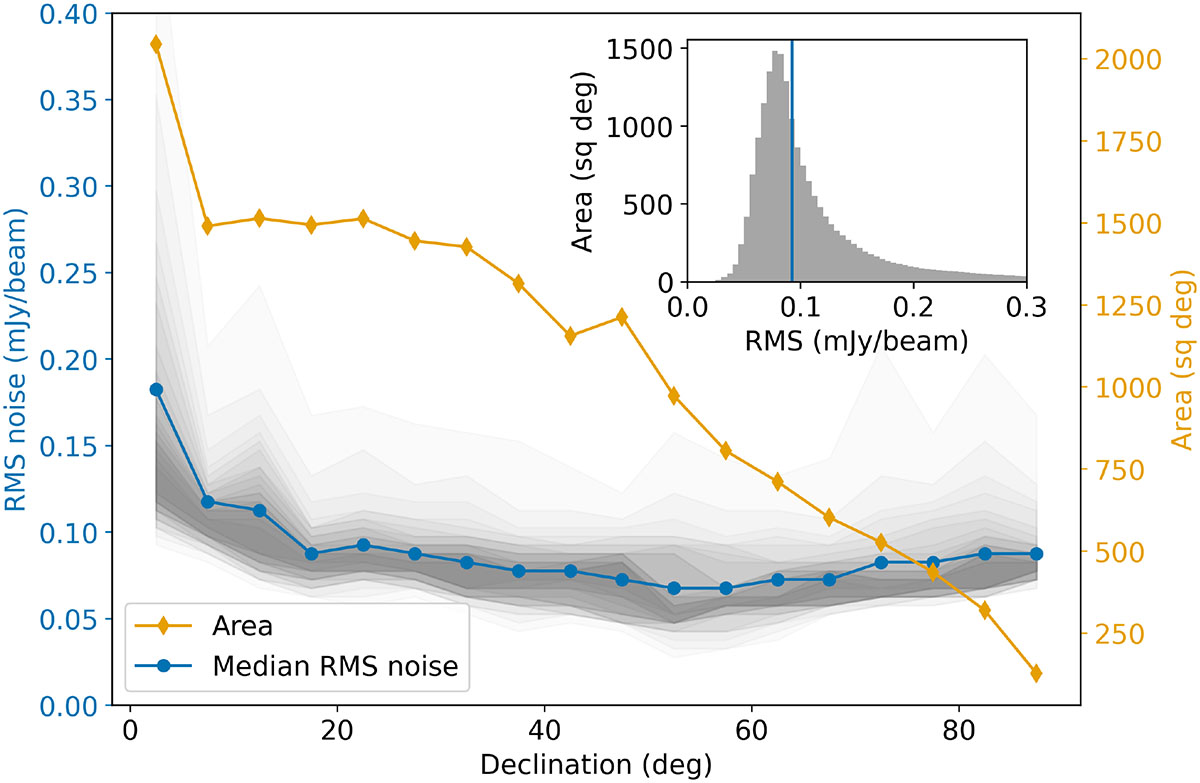
Sensitivity of the LoTSS-DR3 mosaics as a function of declination. The blue points and line show the median sensitivity as a function of declination in 5° strips. The orange curve shows the sky area covered by our mosaics in each declination strip. The grey shading shows the 95%, 90%, 85% etc sensitivity level for the noise pixels in each declination range. The inset shows the distribution of noise in the entirety of LoTSS-DR3 and the median noise level of 92 μJy beam−1 is marked in blue.
Current usage metrics show cumulative count of Article Views (full-text article views including HTML views, PDF and ePub downloads, according to the available data) and Abstracts Views on Vision4Press platform.
Data correspond to usage on the plateform after 2015. The current usage metrics is available 48-96 hours after online publication and is updated daily on week days.
Initial download of the metrics may take a while.