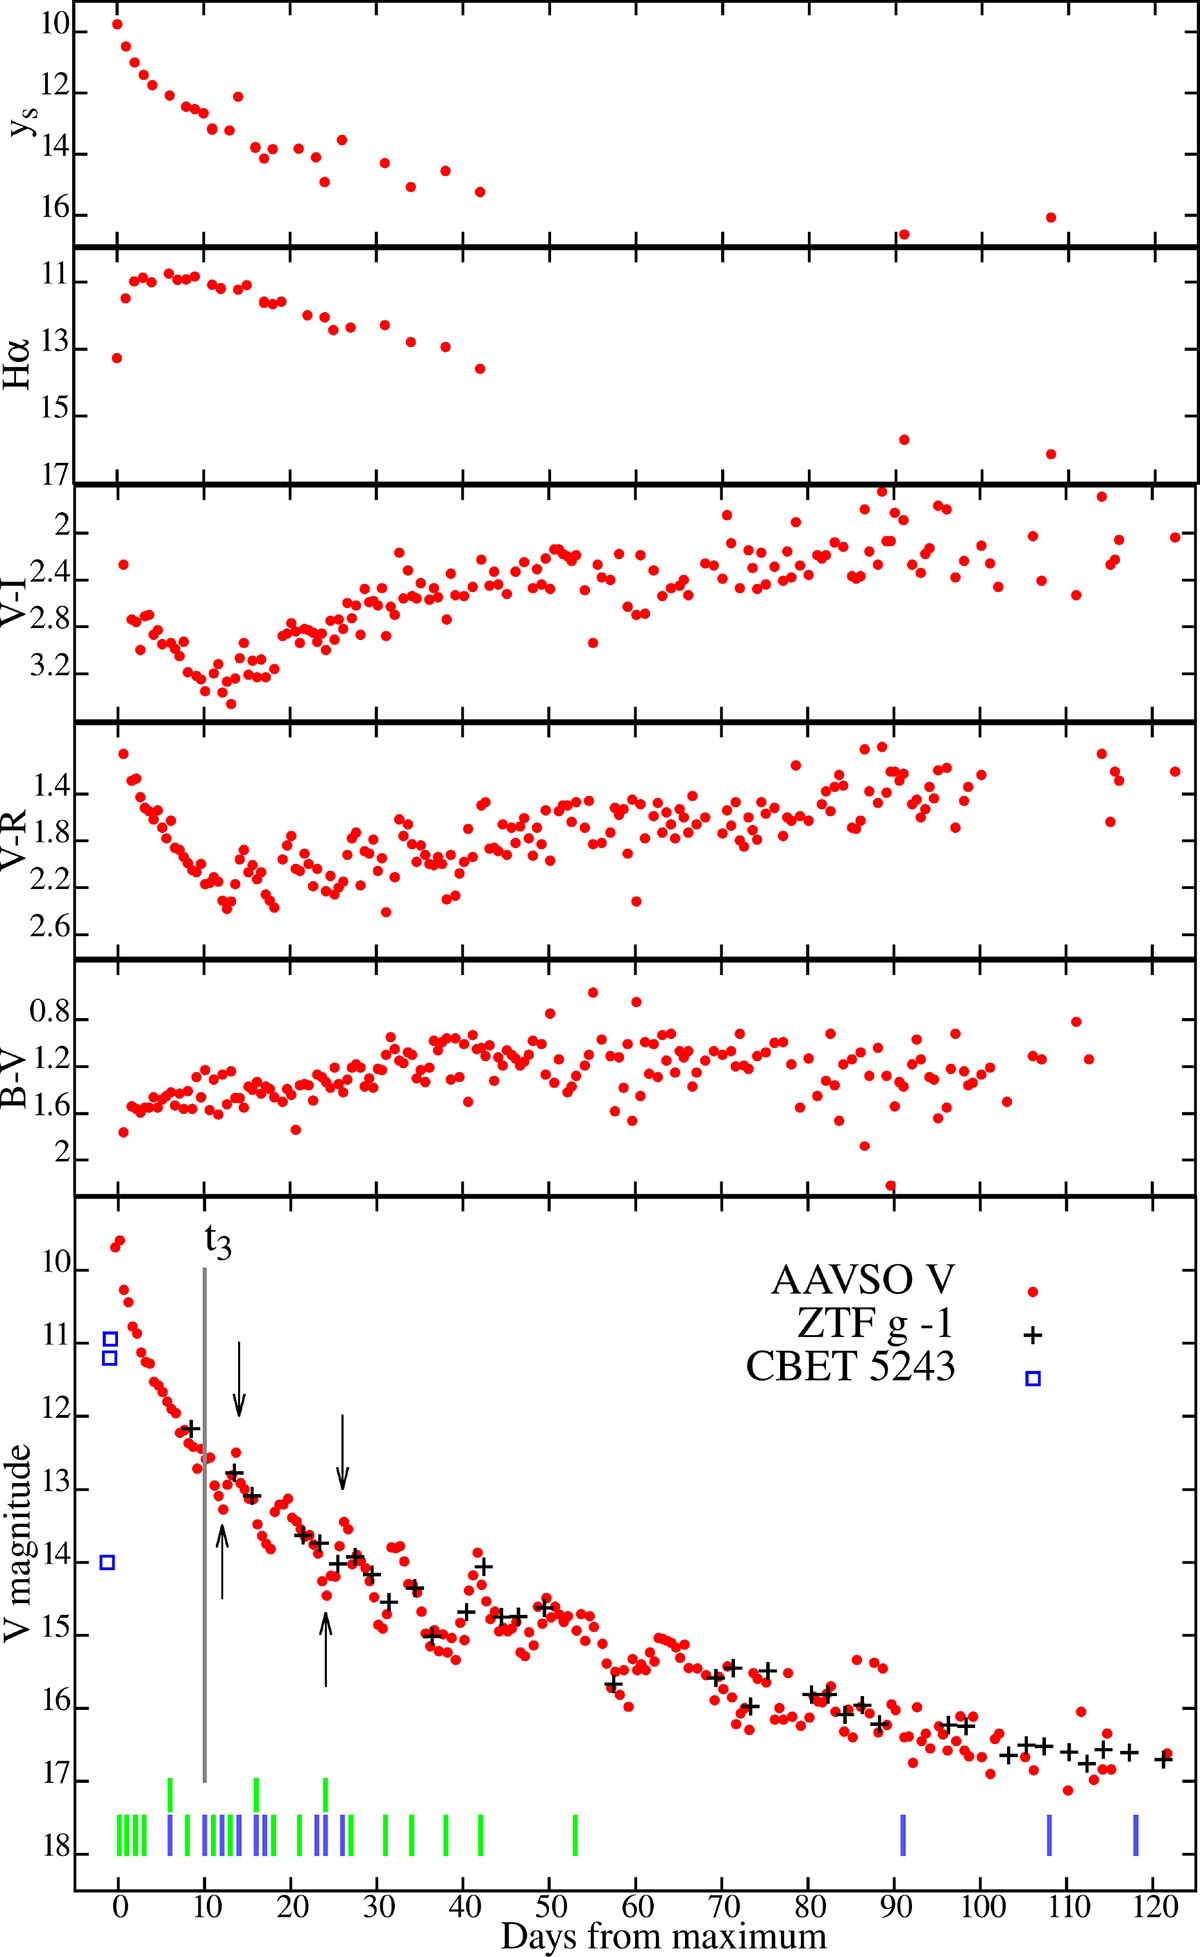
Fig. 1.
Download original image
Colour and light curves of Nova Vul 2024. The Strömgren y-band magnitude and the Hα emission-line flux, expressed in magnitudes, are obtained by integrating the flux-calibrated spectra. Black dots are ZTF g magnitudes rescaled to AAVSO V magnitudes by adding a −1 mag offset. The observing epochs are counted as days passed since optical maximum (2024 Jul. 30.8 UT). The green ticks in the V-band panel mark the epoch of Echelle observations, while the blue ticks are the epochs of low resolution spectra. The arrows point to epochs of spectra shown in Fig. 7 that were obtained at minima and maxima during oscillation period.
Current usage metrics show cumulative count of Article Views (full-text article views including HTML views, PDF and ePub downloads, according to the available data) and Abstracts Views on Vision4Press platform.
Data correspond to usage on the plateform after 2015. The current usage metrics is available 48-96 hours after online publication and is updated daily on week days.
Initial download of the metrics may take a while.