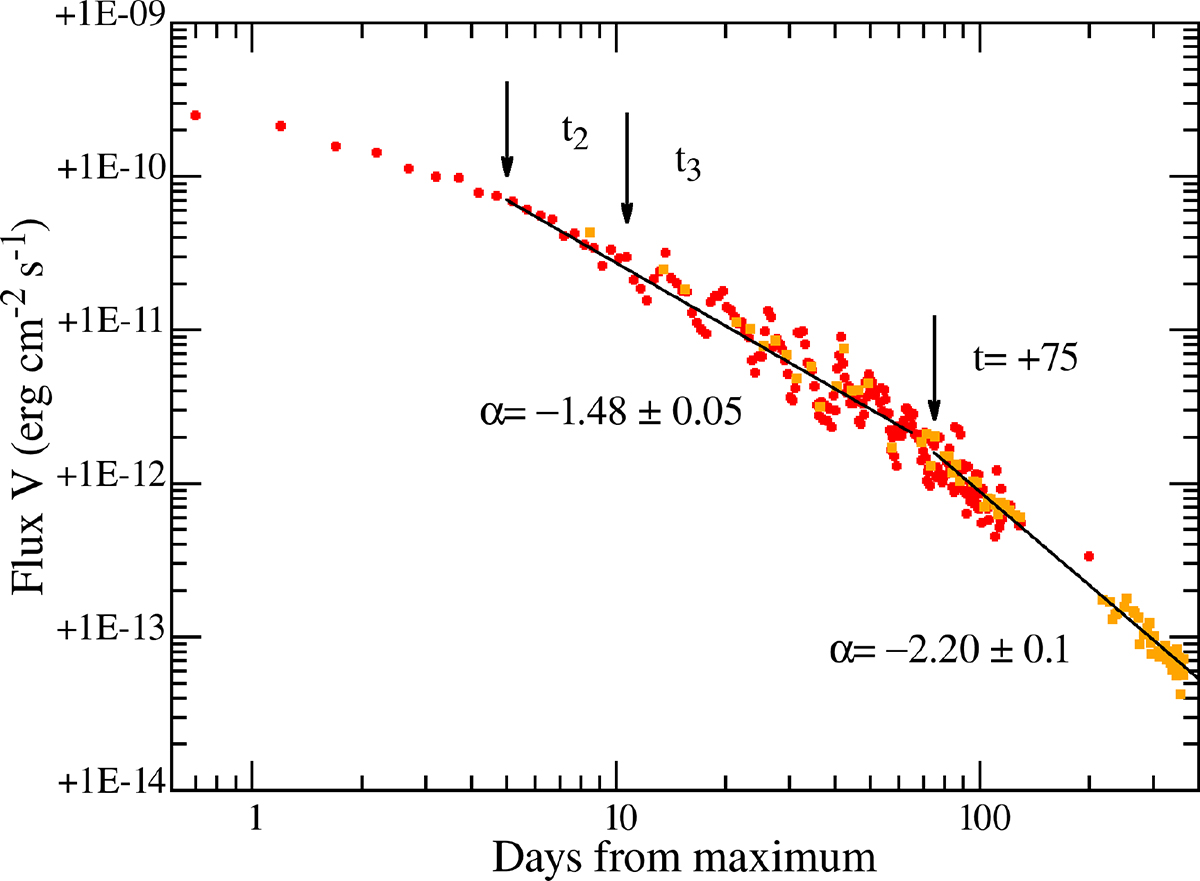
Fig. 2.
Download original image
Log-log plot of the time evolution of the flux radiated by NVul24 through the V band. The fit with a broken power-law of the form FV ∝ (t − t0)α is overplotted (lines in black) and the corresponding values of α are quoted. Red dots are from AAVSO magnitudes, binned each half-day. Orange dots are from ZTF g magnitudes rescaled to V magnitudes by adding a −1 mag offset.
Current usage metrics show cumulative count of Article Views (full-text article views including HTML views, PDF and ePub downloads, according to the available data) and Abstracts Views on Vision4Press platform.
Data correspond to usage on the plateform after 2015. The current usage metrics is available 48-96 hours after online publication and is updated daily on week days.
Initial download of the metrics may take a while.