Open Access
Fig. 5.
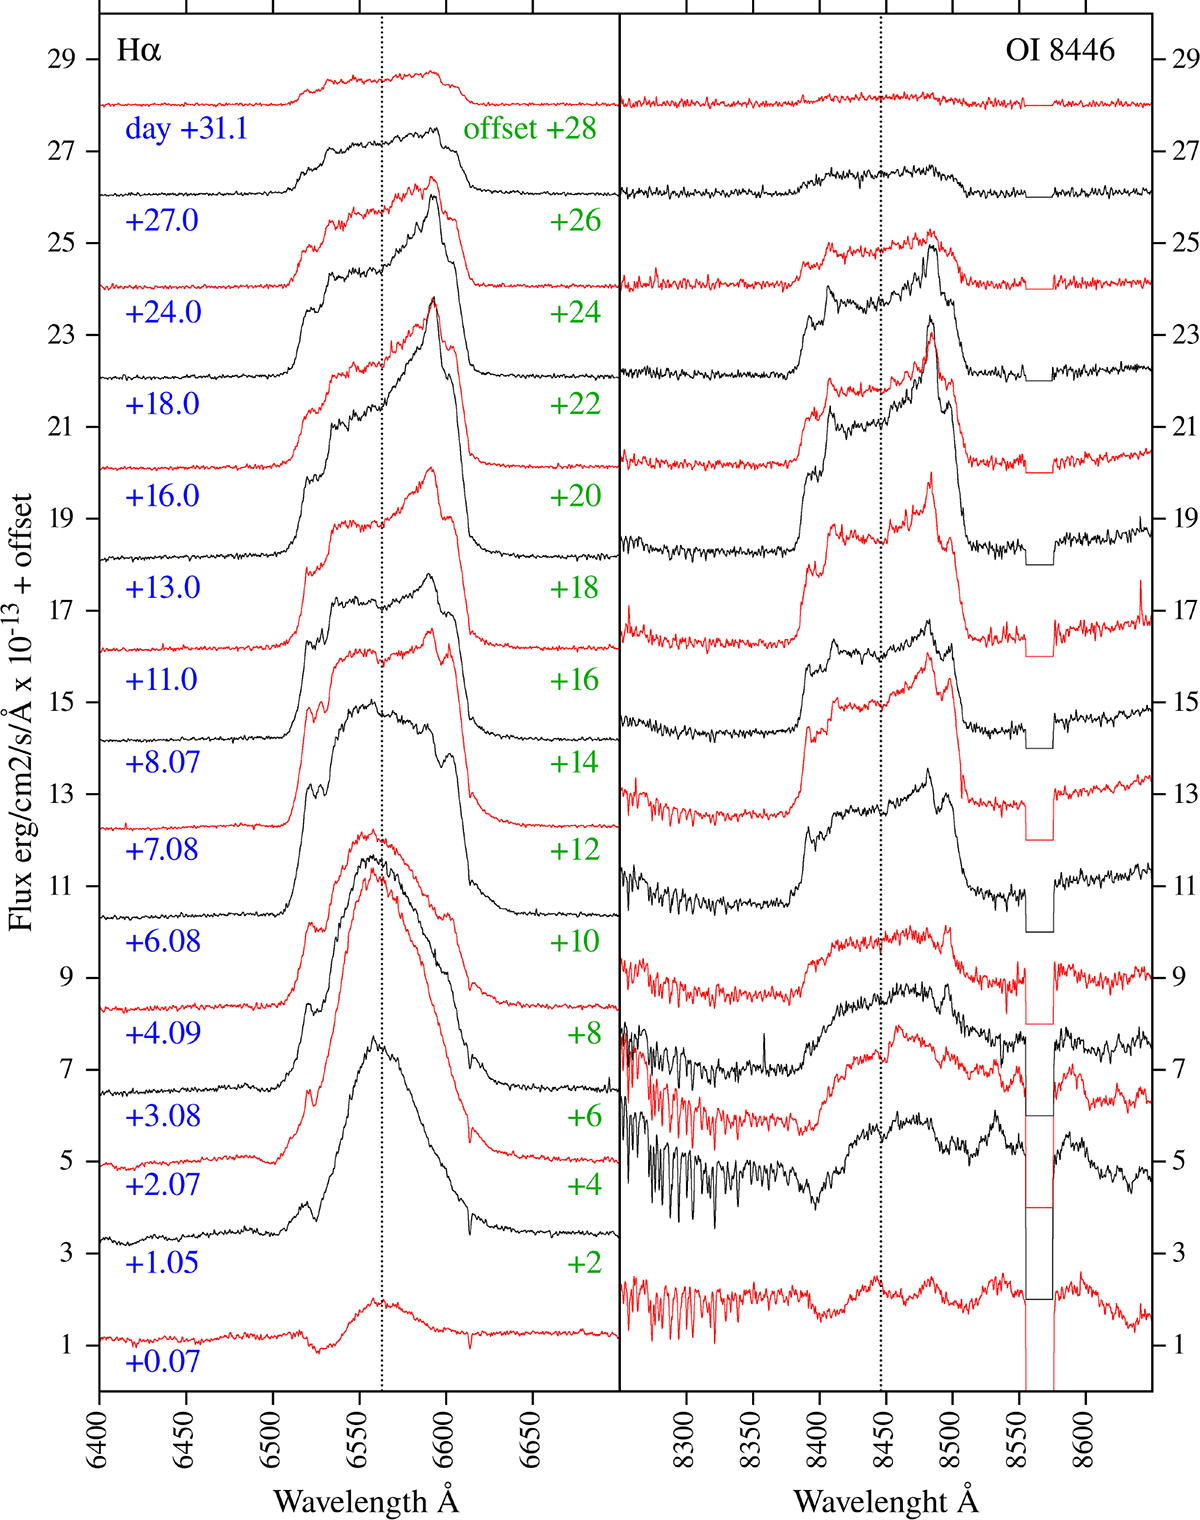
Download original image
Evolution of Hα, and OI 8446 Å emission lines. The Hα line profile has been corrected for telluric absorbptions. No correction was applied to OI 8446 Å line because telluric absorptions ends redward 8377 Å. The drop in intensity between 8555 and 8575 Å is artificial and represents an inter-order gap in the Echelle spectra.
Current usage metrics show cumulative count of Article Views (full-text article views including HTML views, PDF and ePub downloads, according to the available data) and Abstracts Views on Vision4Press platform.
Data correspond to usage on the plateform after 2015. The current usage metrics is available 48-96 hours after online publication and is updated daily on week days.
Initial download of the metrics may take a while.