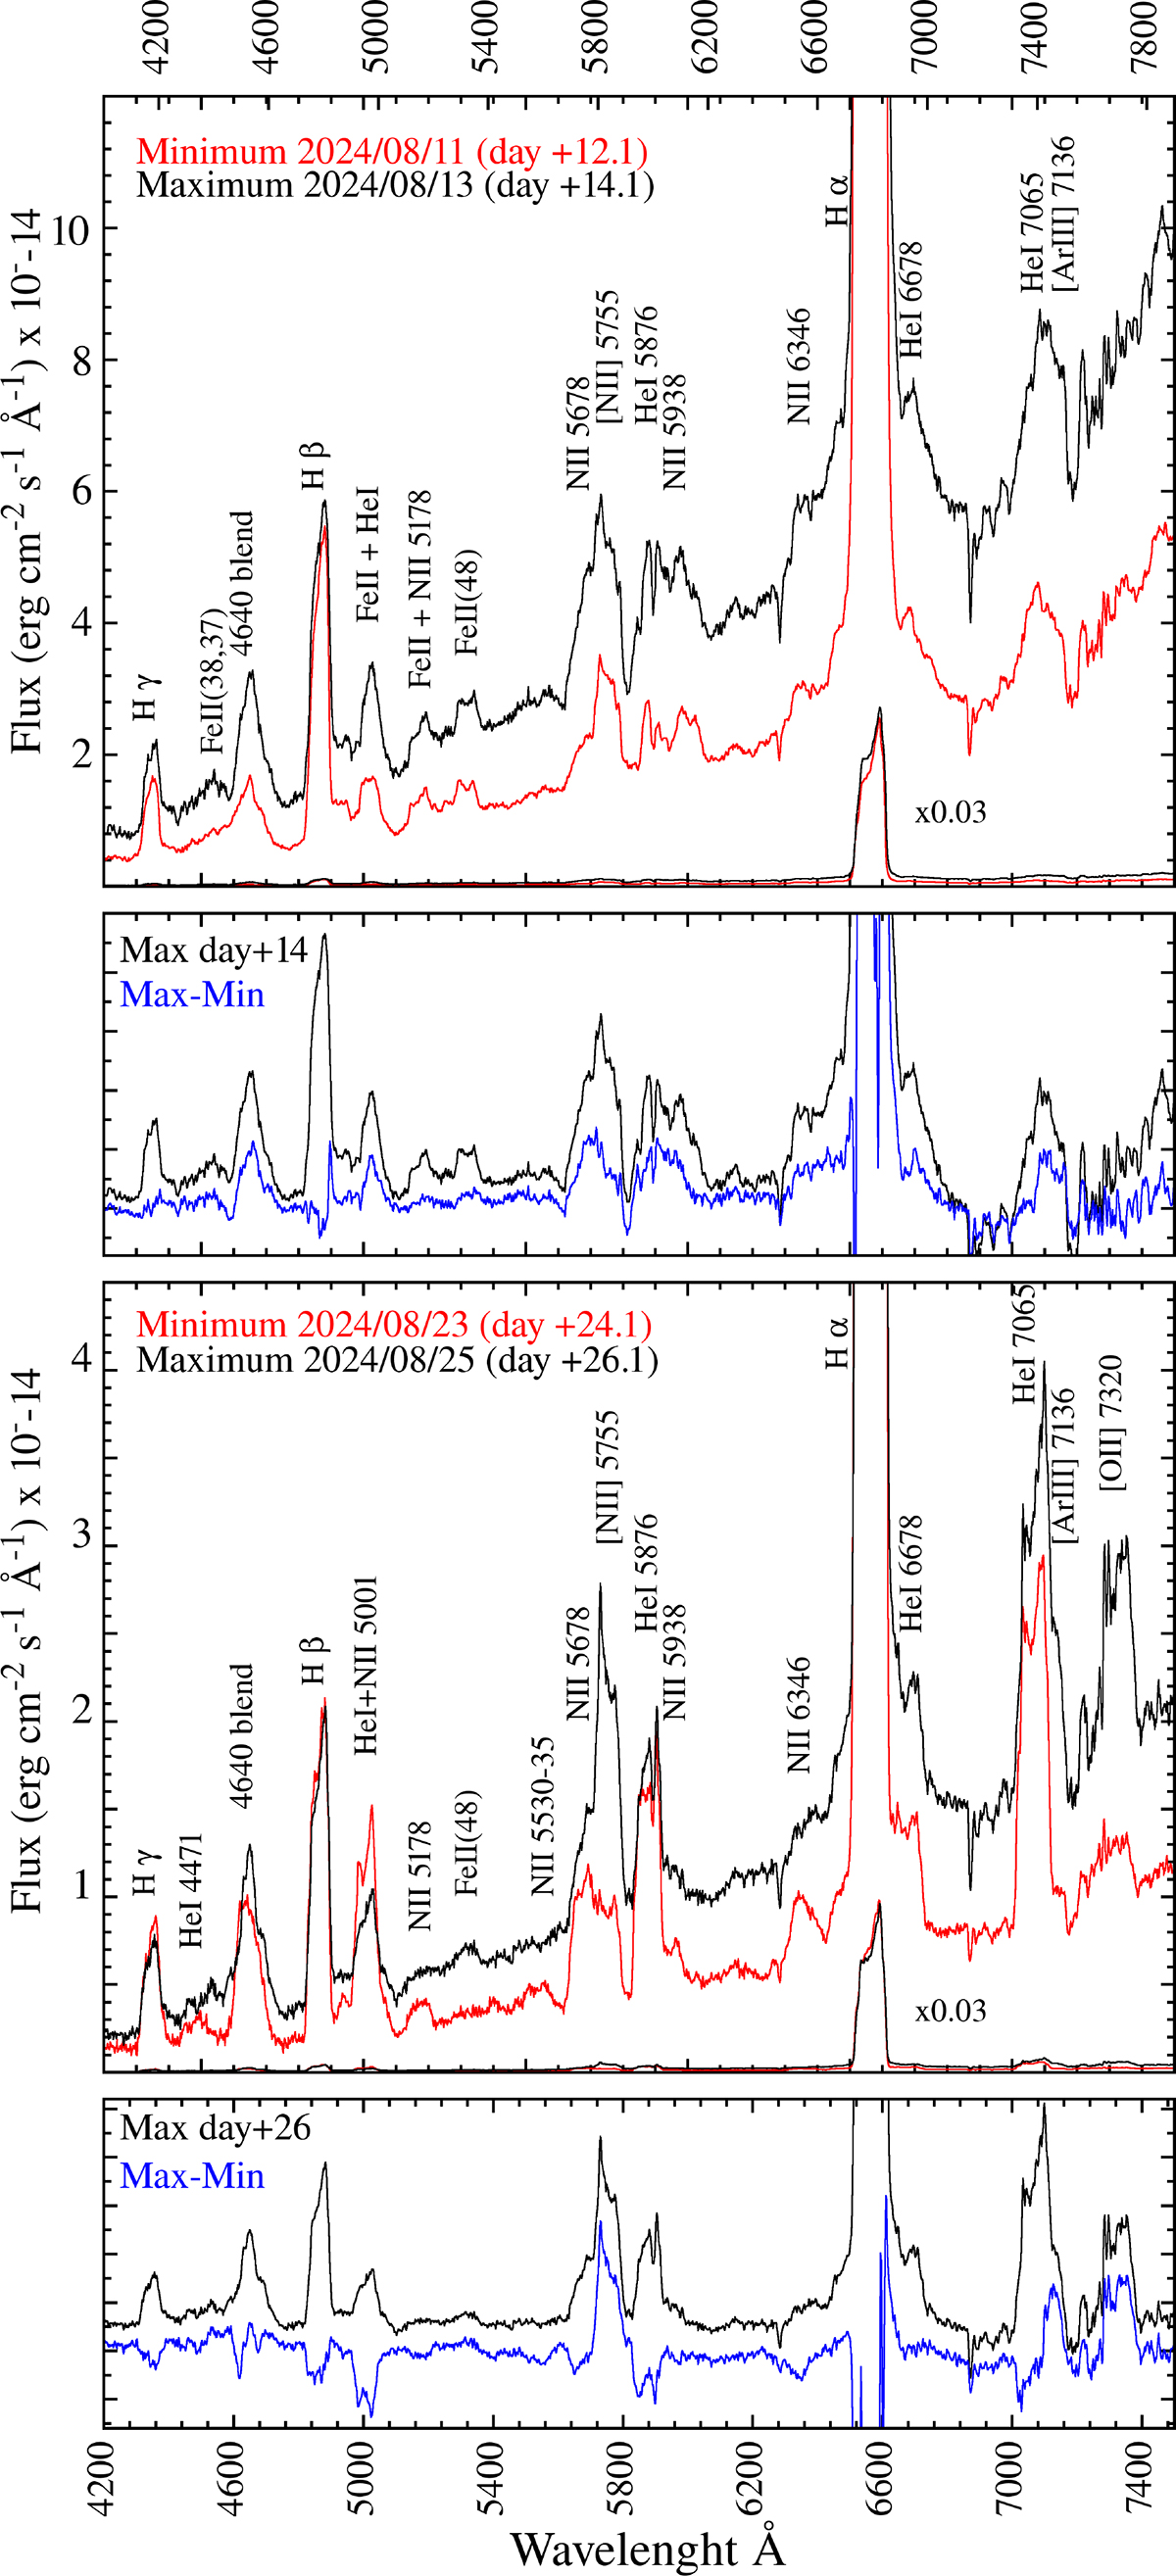
Fig. 7.
Download original image
Spectral evolution through oscillations. Large panels: Absolutely fluxed spectral evolution between maxima (black) and minima (red) across the first and third pscillations. To show the evolution of Hα, the same spectra are also superimposed reduced by a factor of 50. Small panels: difference spectrum (blue) between continuum subtracted spectra at maximum and at minimum, compared to the spectrum at maximum (black).
Current usage metrics show cumulative count of Article Views (full-text article views including HTML views, PDF and ePub downloads, according to the available data) and Abstracts Views on Vision4Press platform.
Data correspond to usage on the plateform after 2015. The current usage metrics is available 48-96 hours after online publication and is updated daily on week days.
Initial download of the metrics may take a while.