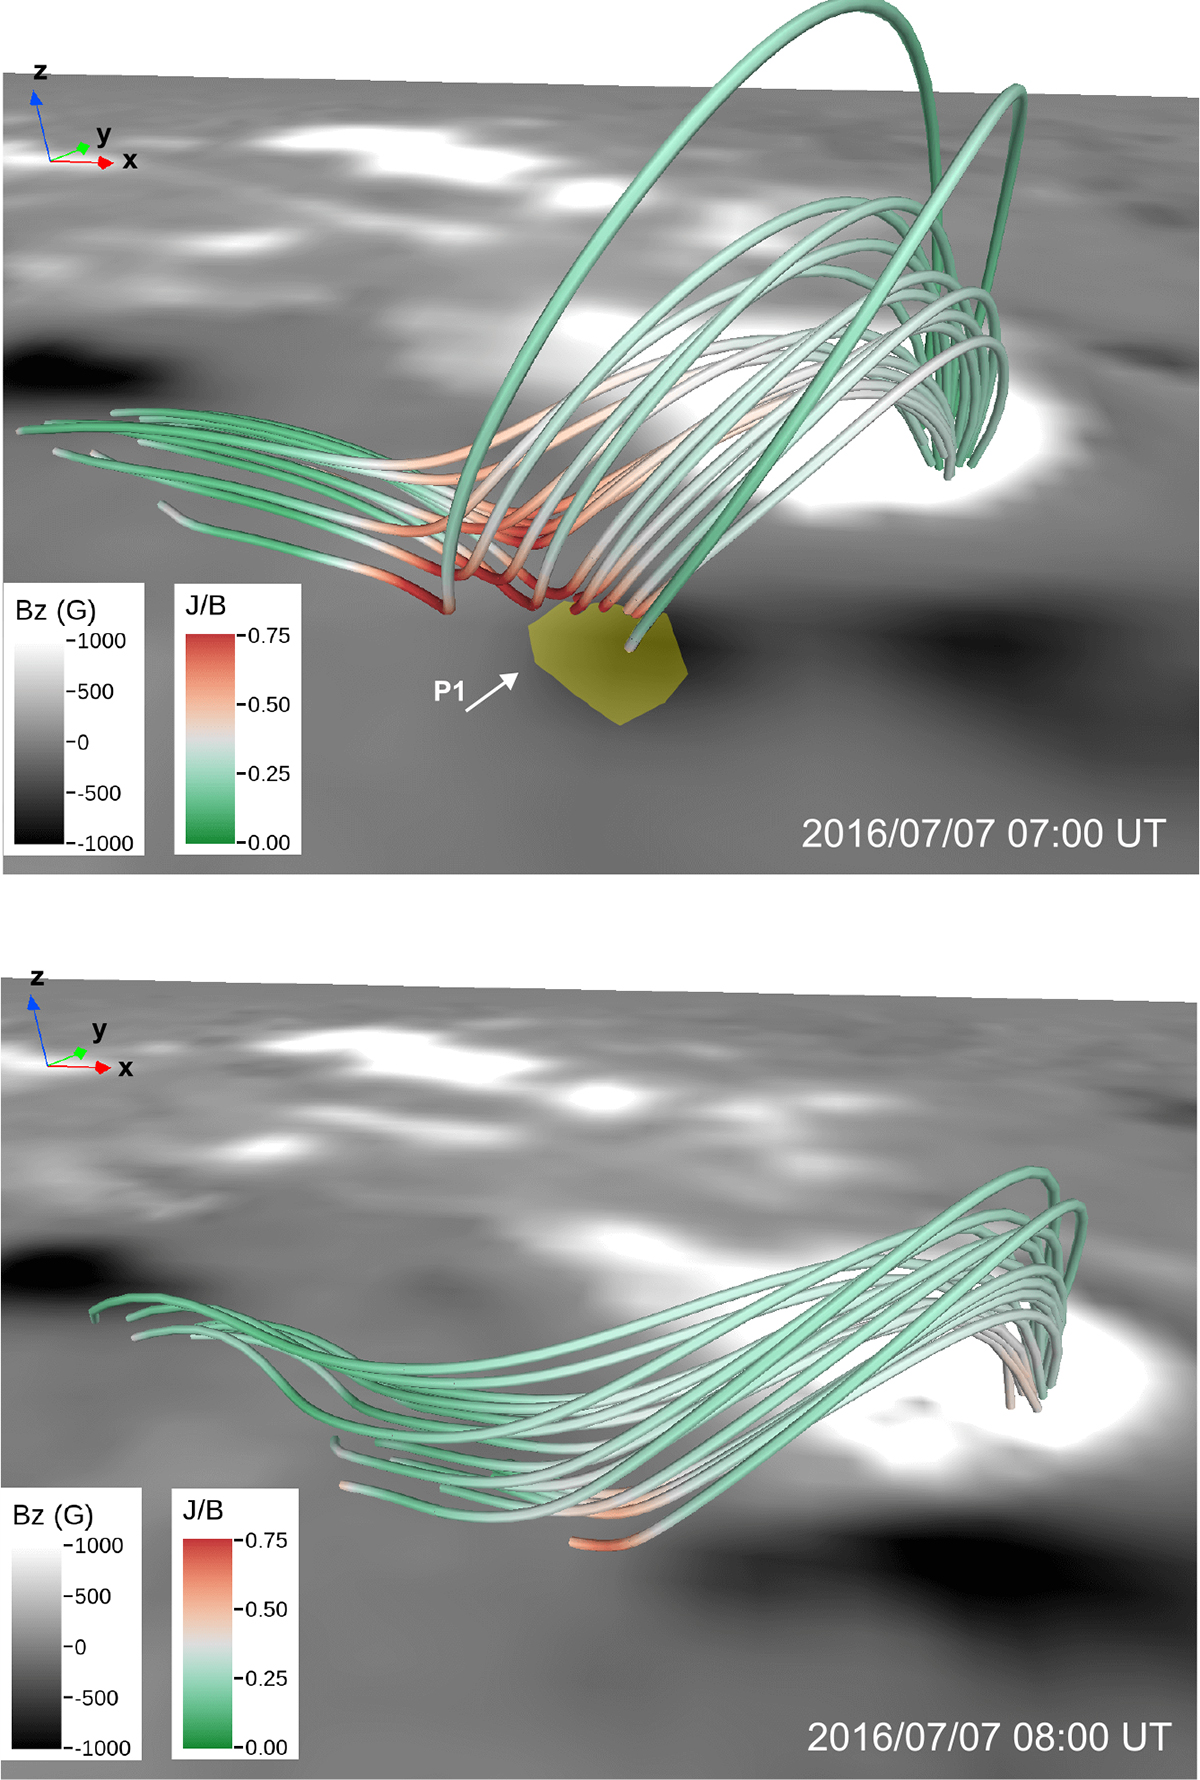
Fig. 11.
Download original image
Side view of the magnetic topology from NFFF extrapolations before the flare (top at 07:00 UT and bottom at 08:00 UT). The lower boundary shows photospheric HMI Bz (±1000 G). The field lines are colored by J/B in units of pix−1; the red highlighting indicates possible reconnection sites. The yellow area indicates the location of the localized heating P1 observed with TRIPPLE-SP.
Current usage metrics show cumulative count of Article Views (full-text article views including HTML views, PDF and ePub downloads, according to the available data) and Abstracts Views on Vision4Press platform.
Data correspond to usage on the plateform after 2015. The current usage metrics is available 48-96 hours after online publication and is updated daily on week days.
Initial download of the metrics may take a while.