Open Access
Fig. 2.
Download original image
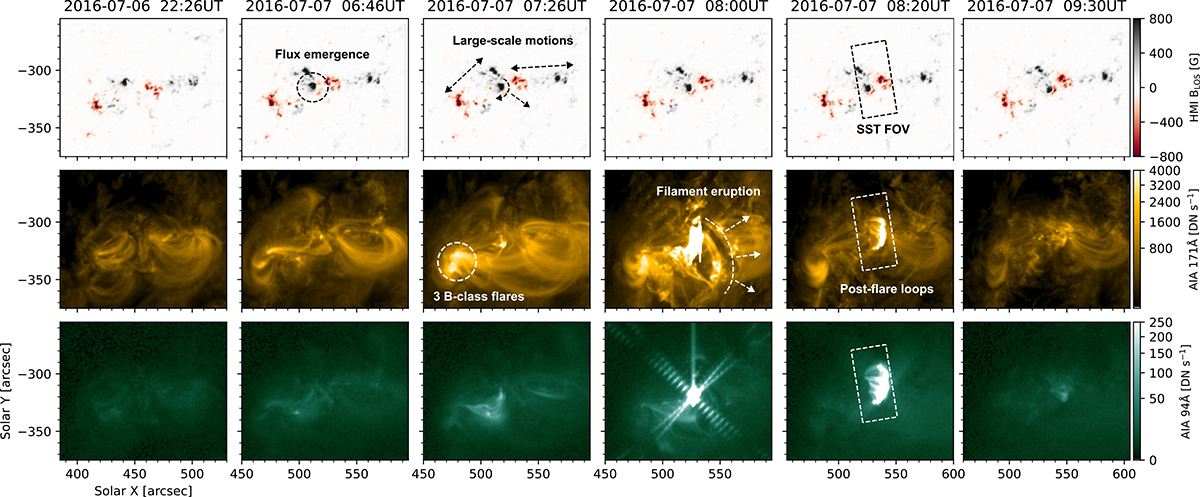
Context images showing the evolution of AR 12561 on 2016 July 6–7. The panels show SDO/HMI line-of-sight magnetograms (top row), SDO/AIA 171 Å (middle row), and SDO/AIA 94 Å (bottom row) at six different times. The approximate FOV of the SST observations is indicated by the dashed rectangle in the fifth column.
Current usage metrics show cumulative count of Article Views (full-text article views including HTML views, PDF and ePub downloads, according to the available data) and Abstracts Views on Vision4Press platform.
Data correspond to usage on the plateform after 2015. The current usage metrics is available 48-96 hours after online publication and is updated daily on week days.
Initial download of the metrics may take a while.