Fig. 3.
Download original image
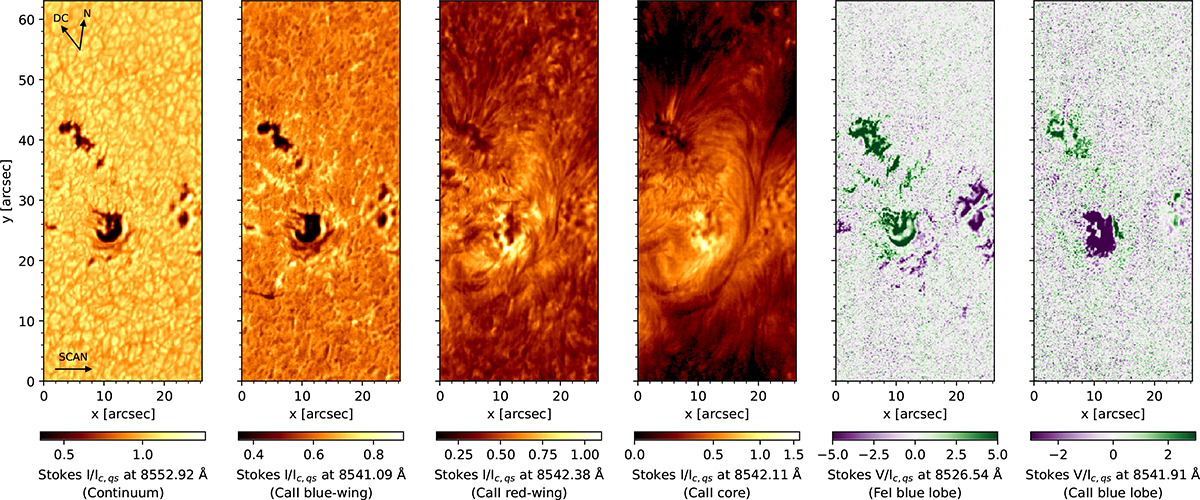
High-resolution view of the target region from the first SST/TRIPPEL-SP scan (07:37–07:54 UT), taken just before the flare starts. From left to right: Intensity in the far wing of Ca II 8542 Å (photosphere); outer wing (upper photosphere); inner wing (lower chromosphere); at the line core (mid-chromosphere). The last two panels show Stokes V maps in the photospheric Fe I 8526.67 Å line and the chromospheric Ca II 8542 Å line, respectively. The black arrows indicate the solar north and disk center. The horizontal axis corresponds to the scan direction (left to right). All panels are in units of the average quiet Sun continuum intensity.
Current usage metrics show cumulative count of Article Views (full-text article views including HTML views, PDF and ePub downloads, according to the available data) and Abstracts Views on Vision4Press platform.
Data correspond to usage on the plateform after 2015. The current usage metrics is available 48-96 hours after online publication and is updated daily on week days.
Initial download of the metrics may take a while.