Fig. 4.
Download original image
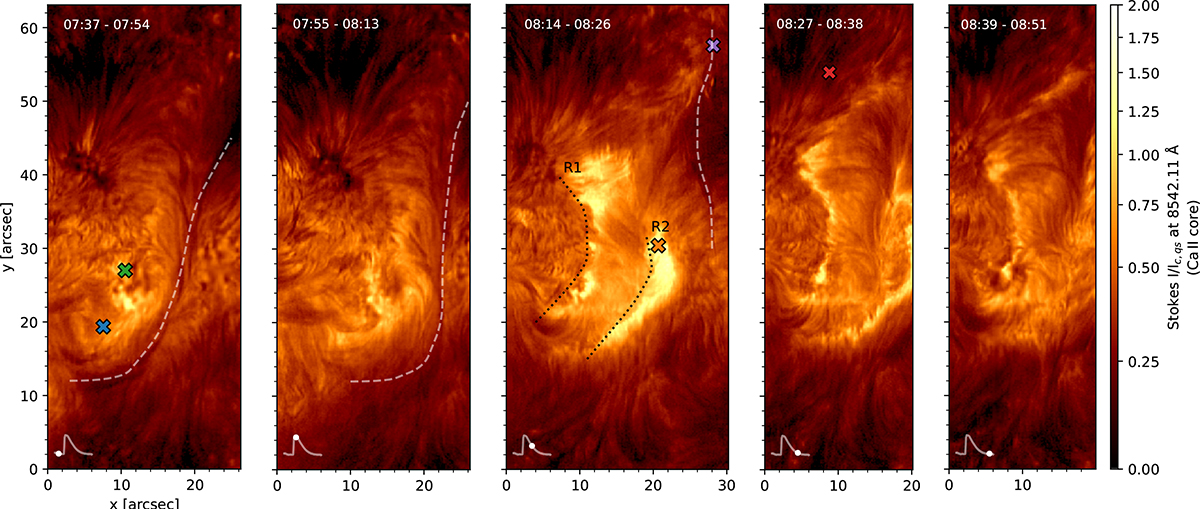
Evolution of the active region as seen in the Ca II 8542 Å line core intensity, from the five SST/TRIPPEL-SP scans. The time interval covered by each scan is indicated in the top left corner. The GOES 1–8 Å X-ray flux is plotted below each panel marking the mid-time of each scan. The location of the erupting filament’s spine (inferred from multiple wavelengths) is indicated by the white dashed line and the flare ribbons (R1, R2) as dotted lines. The crosses indicate the location of the profiles shown in Fig. 5.
Current usage metrics show cumulative count of Article Views (full-text article views including HTML views, PDF and ePub downloads, according to the available data) and Abstracts Views on Vision4Press platform.
Data correspond to usage on the plateform after 2015. The current usage metrics is available 48-96 hours after online publication and is updated daily on week days.
Initial download of the metrics may take a while.