Fig. 6.
Download original image
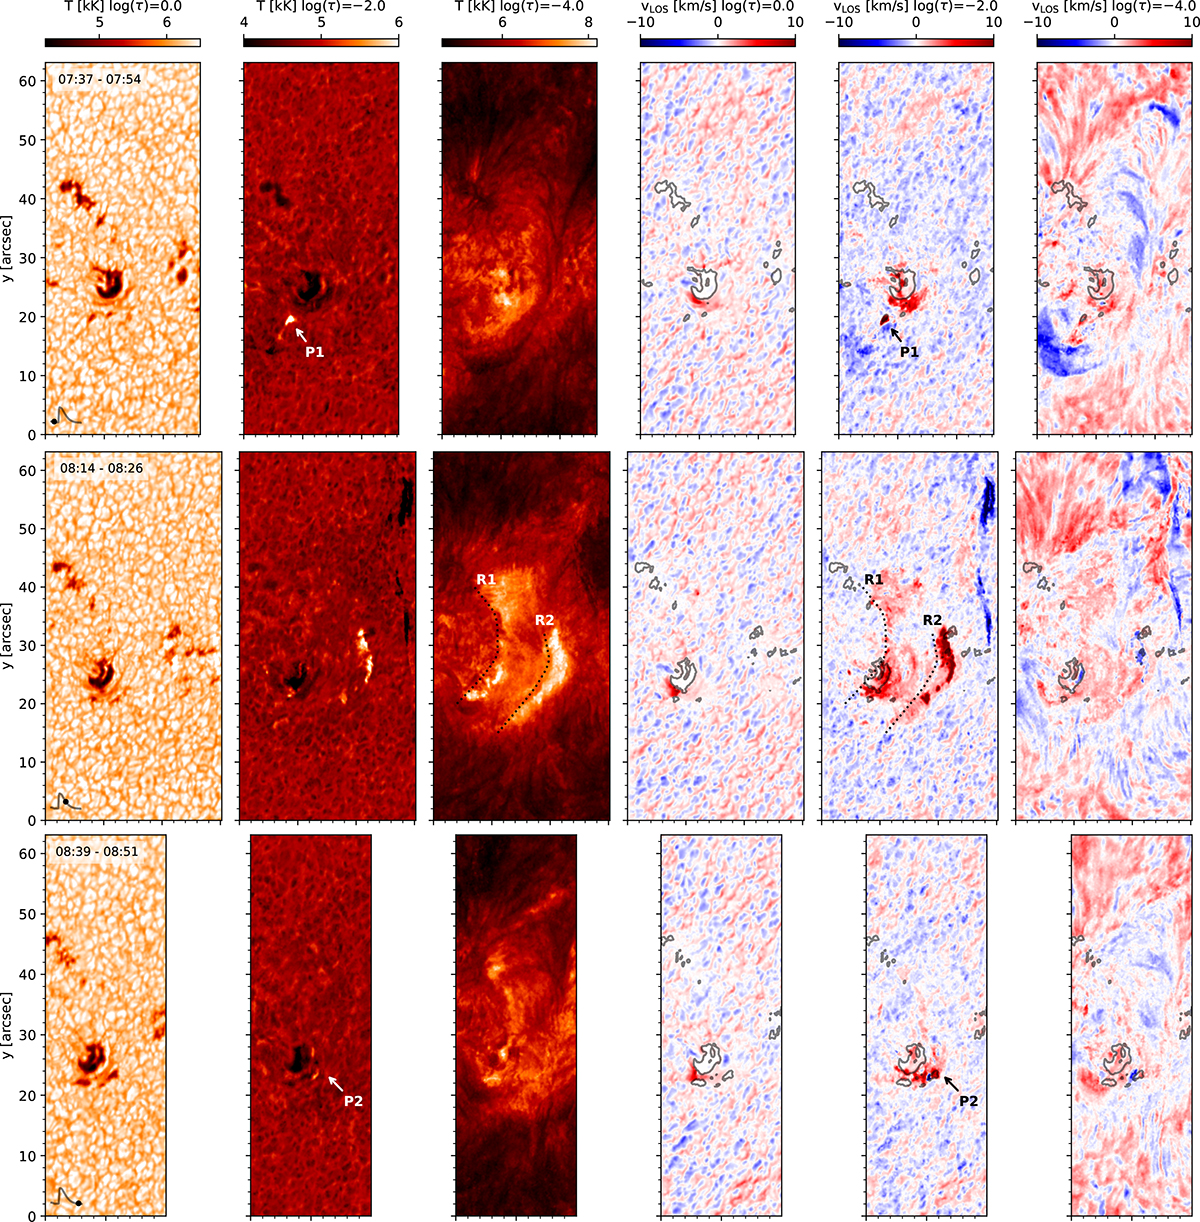
Atmospheric stratification inferred from NLTE inversions of Fe I 8526 Å and Ca II 8542 Å for three scans: Scan 1 (07:36–07:48 UT, onset–pre-peak), Scan 3 (08:14–08:26 UT, post-peak–main phase), and Scan 5 (08:39–08:51 UT, decay). Each row corresponds to a scan. The columns show, from left to right, temperature (T) and LOS velocity (vLOS) maps at three optical depths (log τ = 0.0, −2.0, −4.0). Positive (red) velocities indicate downflows, while negative (blue) velocities indicate upflows. The gray contours at T= 5.5 kK (log τ = 0.0) highlight the pores at the photosphere and the dotted lines are the location of the flare ribbons.
Current usage metrics show cumulative count of Article Views (full-text article views including HTML views, PDF and ePub downloads, according to the available data) and Abstracts Views on Vision4Press platform.
Data correspond to usage on the plateform after 2015. The current usage metrics is available 48-96 hours after online publication and is updated daily on week days.
Initial download of the metrics may take a while.