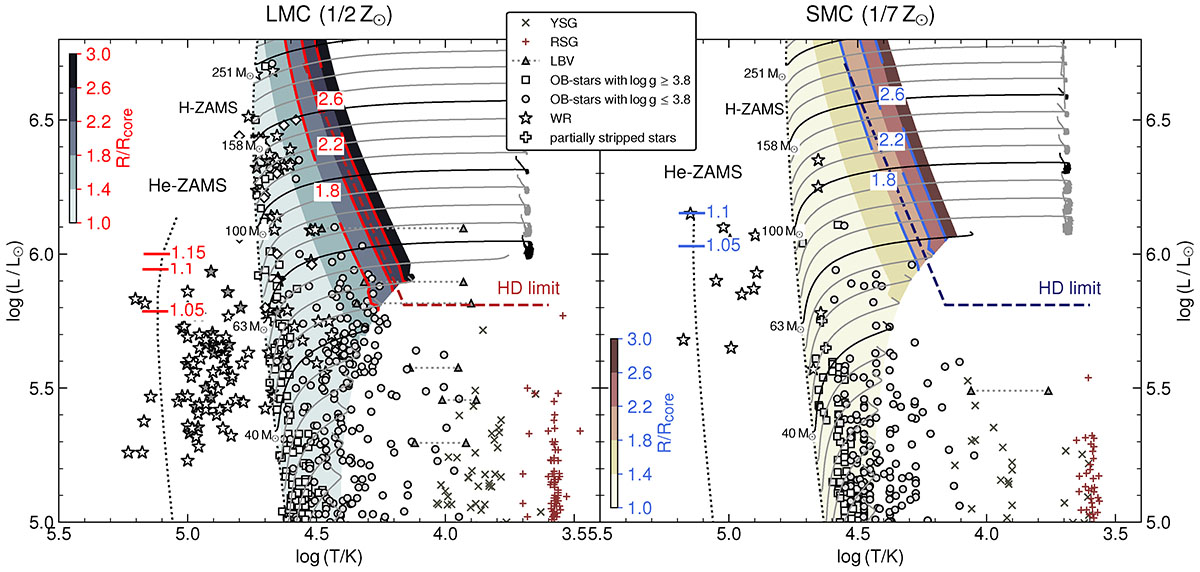
Fig. 1.
Download original image
Hertzsprung-Russell diagrams of the massive star population (symbols) in the LMC (left) and SMC (right). The different symbols mark the positions of observed RSG (small red plusses, Davies et al. 2018; Yang et al. 2023), YSG (crosses, Neugent et al. 2010, 2012), LBVs (filled triangles with quiescent and outburst positions, Humphreys et al. 2016; Kalari et al. 2018), OB stars (open circles and squares, Evans et al. 2004; Trundle et al. 2004; Trundle & Lennon 2005; Hunter et al. 2008; Bestenlehner et al. 2011; Bouret et al. 2013; Urbaneja et al. 2017; Castro et al. 2018; Schneider et al. 2018; Ramachandran et al. 2018, 2019; Dufton et al. 2019; Bestenlehner 2020; Bouret et al. 2021; Rickard et al. 2022; Pauli et al. 2023; Bernini-Peron et al. 2024; Gómez-González et al. 2025; Alkousa et al. 2025), partially stripped stars (white large plusses Pauli et al. 2022; Rickard & Pauli 2023; Ramachandran et al. 2023, 2024), and WR stars (white stars for apparent single, gray stars for binaries Crowther et al. 2002; Hainich et al. 2014, 2015; Tramper et al. 2015; Shenar et al. 2016, 2019). The empirical HD limit (Humphreys & Davidson 1979) is indicated by the hatched regions. Solid black and gray lines show stellar evolution tracks of the Model no-Eject until core hydrogen depletion. For clarity only the tracks with initial masses Mini = 40 M⊙, 63 M⊙, 100 M⊙, 158 M⊙, and 251 M⊙ are labeled and colored in black. Dotted black lines mark the H-ZAMS and He-ZAMS. Contours in the background highlight the degree of inflation covering R/Rcore = 1 – 3. Inflations of R/Rcore = 1.6, 2.2, and 2.8 for stars during hydrogen burning, and R/Rcore = 1.05, 1.1, and 1.15 for the He-ZAMS models are marked by colored lines and numbers.
Current usage metrics show cumulative count of Article Views (full-text article views including HTML views, PDF and ePub downloads, according to the available data) and Abstracts Views on Vision4Press platform.
Data correspond to usage on the plateform after 2015. The current usage metrics is available 48-96 hours after online publication and is updated daily on week days.
Initial download of the metrics may take a while.