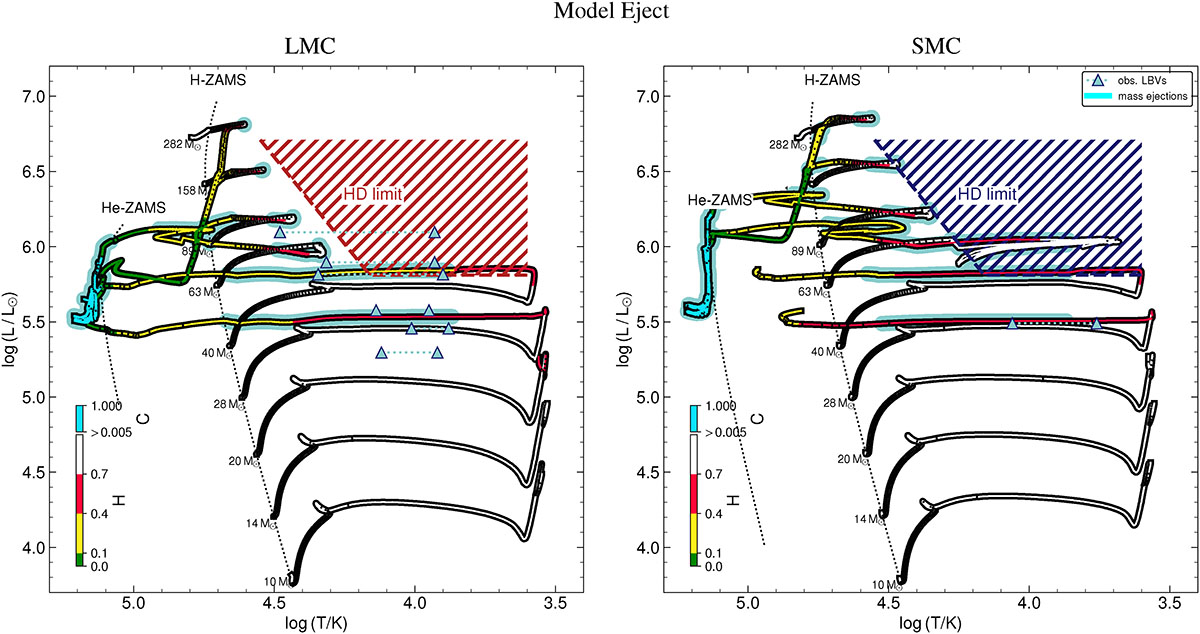
Fig. E.1.
Download original image
Hertzsprung-Russell diagrams showing the tracks of our Model Eject grid for LMC (left) and SMC metallicity (right). The Eddington-limit induced mass ejection episodes of our models are indicated by bold gray outlines around the tracks. Black dots on the tracks indicate equidistant timesteps of Δt = 30 000 yr. For comparison, the known LBVs of the LMC and SMC are shown as triangles during quiescence (left triangle) and outburst (right triangle) (Humphreys et al. 2016; Kalari et al. 2018).
Current usage metrics show cumulative count of Article Views (full-text article views including HTML views, PDF and ePub downloads, according to the available data) and Abstracts Views on Vision4Press platform.
Data correspond to usage on the plateform after 2015. The current usage metrics is available 48-96 hours after online publication and is updated daily on week days.
Initial download of the metrics may take a while.