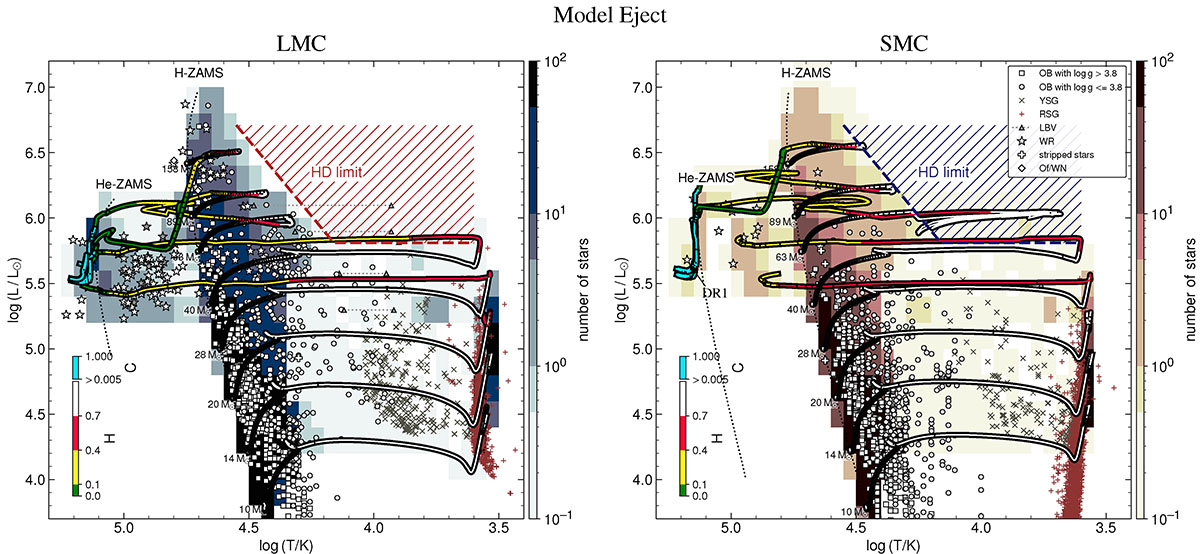
Fig. 3.
Download original image
Hertzsprung-Russell diagrams of the massive star population (symbols) in the LMC (left) and SMC (right) compared to the synthetic population of the Model Eject (contours). A selection of the same stellar evolution models is shown as solid lines, color coded by their surface abundances. Small black dots on the evolution tracks mark equidistant timesteps of Δt = 30 000 yr. The hatched region indicates the empirical HD limit (Humphreys & Davidson 1979). The different symbols mark different stellar groups and have the same sources as mentioned in Fig. 1. In the SMC’s population, we added the WO star DR1 from IC 1613 (Tramper et al. 2013), a galaxy that has an SMC-like metallicity and only this WR star.
Current usage metrics show cumulative count of Article Views (full-text article views including HTML views, PDF and ePub downloads, according to the available data) and Abstracts Views on Vision4Press platform.
Data correspond to usage on the plateform after 2015. The current usage metrics is available 48-96 hours after online publication and is updated daily on week days.
Initial download of the metrics may take a while.