Open Access
Fig. 11.
Download original image
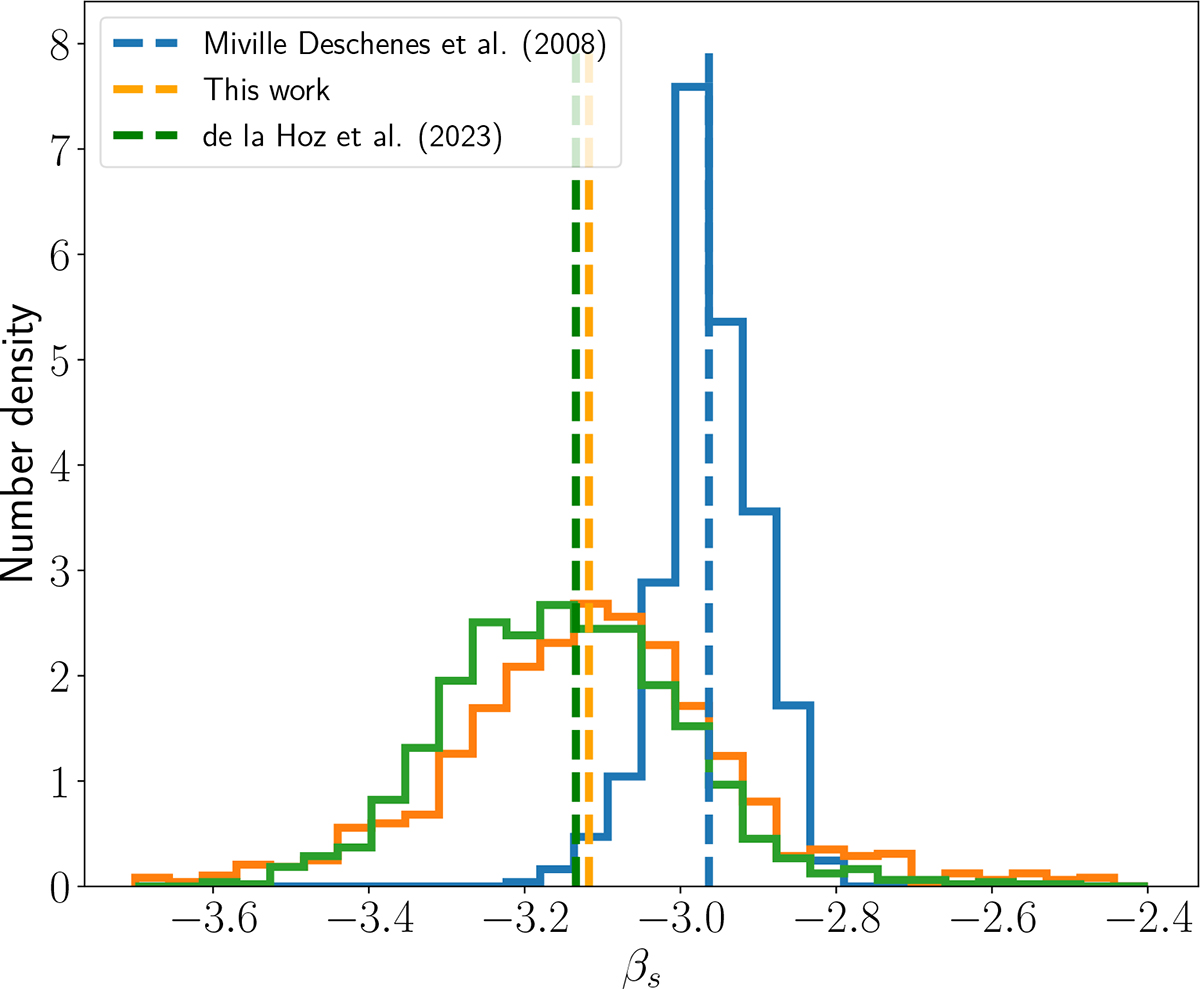
Distribution of the synchrotron spectral index from ‘Model 4’ of Miville-Deschênes et al. (2008) (blue), de la Hoz et al. (2023) (green) and our estimation (orange). The vertical dashed lines correspond to the weighted mean values of the respective distributions.
Current usage metrics show cumulative count of Article Views (full-text article views including HTML views, PDF and ePub downloads, according to the available data) and Abstracts Views on Vision4Press platform.
Data correspond to usage on the plateform after 2015. The current usage metrics is available 48-96 hours after online publication and is updated daily on week days.
Initial download of the metrics may take a while.