Fig. 4.
Download original image
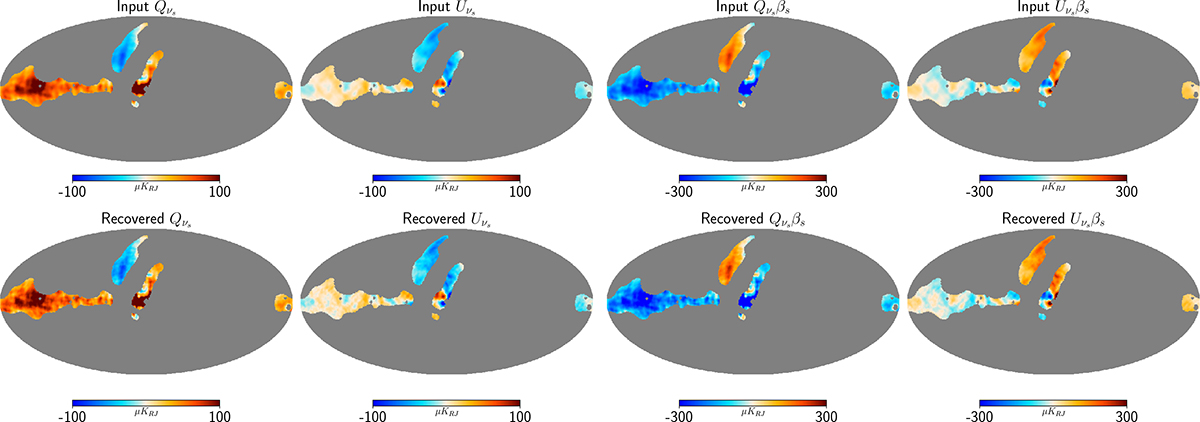
Comparison between input (upper panel) and recovered (lower panel) maps of Qνs(p), Uνs(p) and Qνs(p)βs(p), Uνs(p)βs(p) at the reference frequency of 23 GHz. All maps are shown at resolution of beam FWHM = 2°. The correlation between input and recovered maps is found to be 99% for Q and 95% for U. A similar correlation is found for Qνs(p)βs(p) and Uνs(p)βs(p) between input and recovered maps.
Current usage metrics show cumulative count of Article Views (full-text article views including HTML views, PDF and ePub downloads, according to the available data) and Abstracts Views on Vision4Press platform.
Data correspond to usage on the plateform after 2015. The current usage metrics is available 48-96 hours after online publication and is updated daily on week days.
Initial download of the metrics may take a while.