Fig. 7.
Download original image
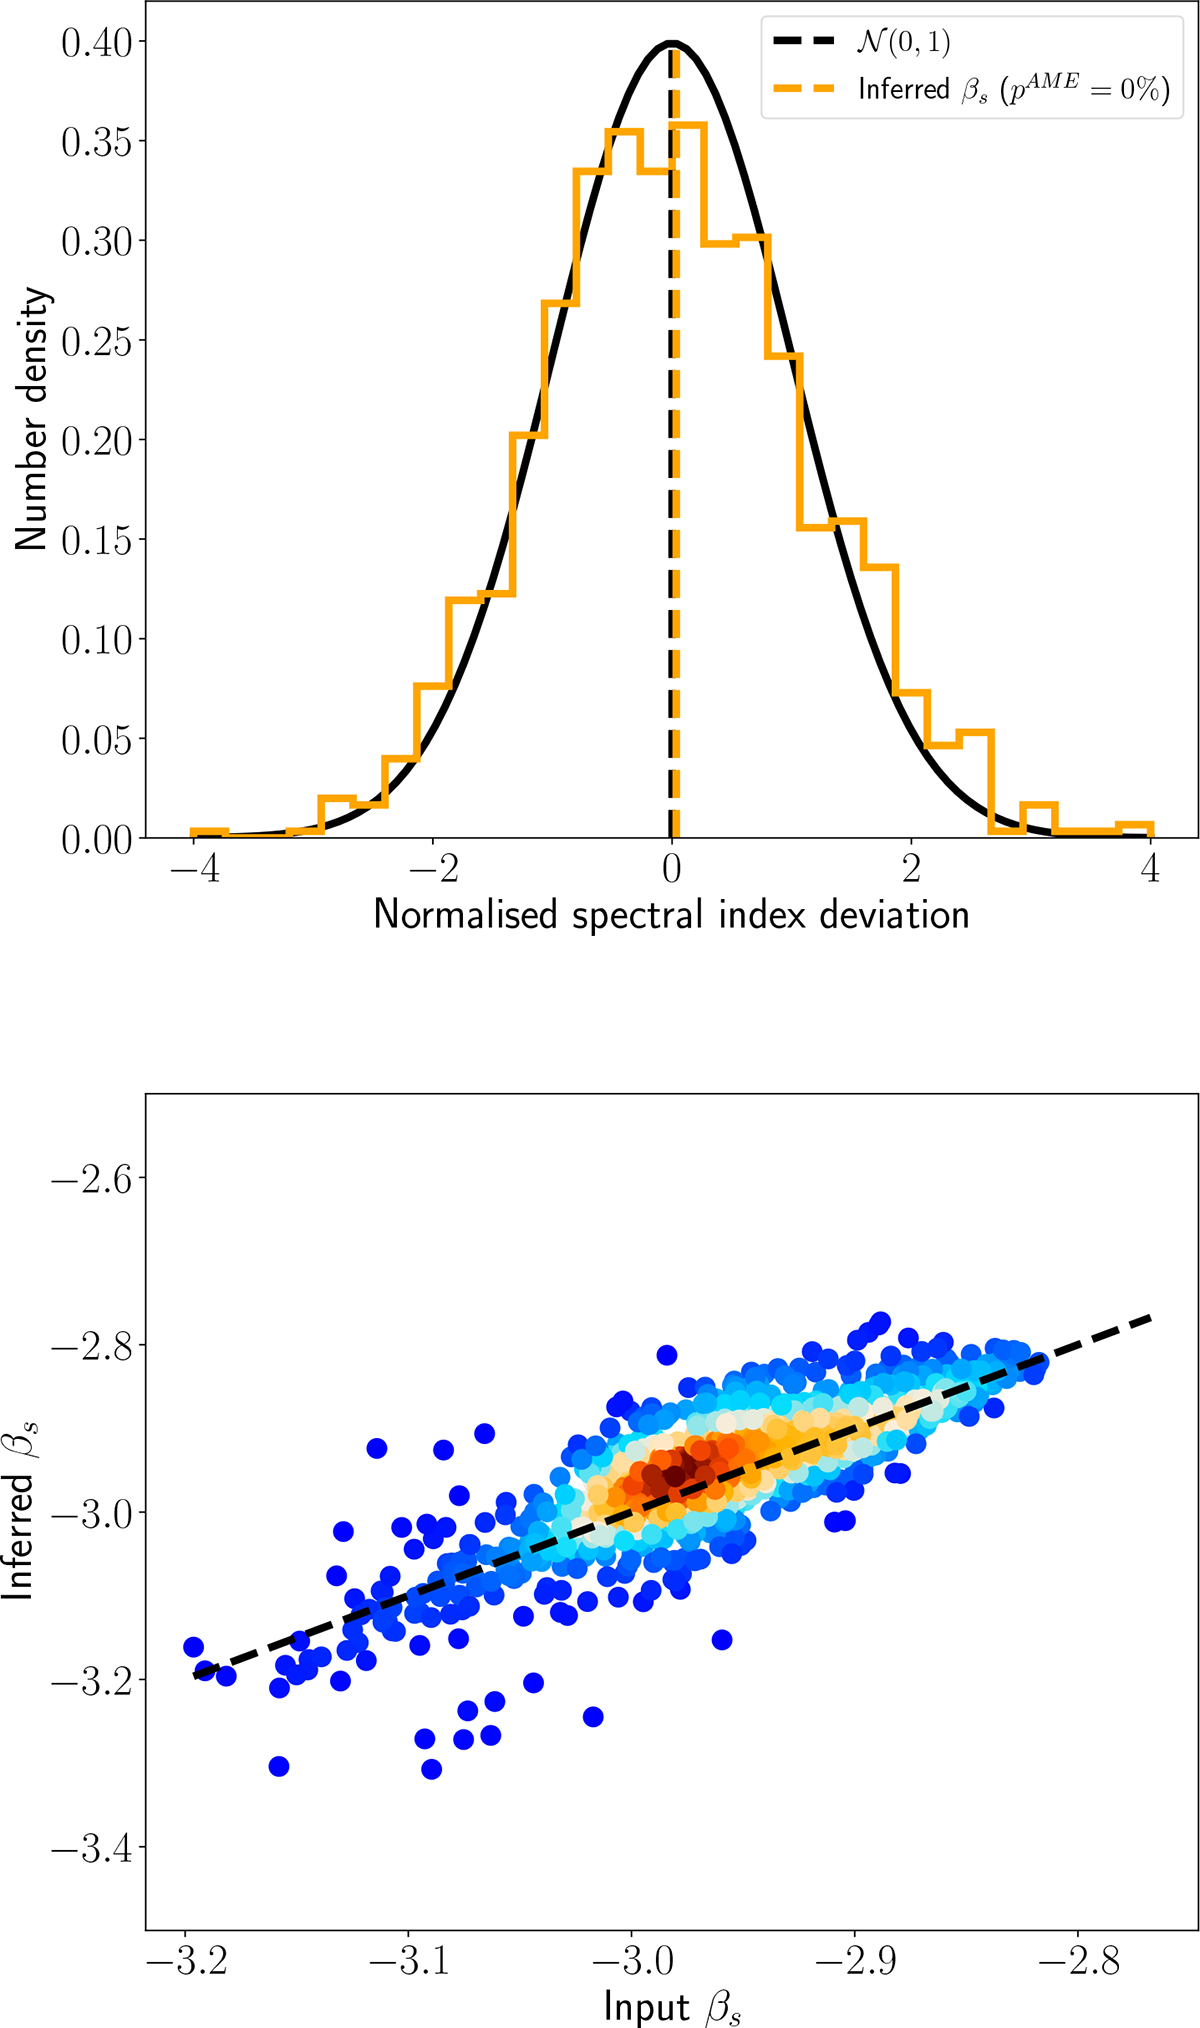
Upper panel: Histogram of the normalised deviation of the derived spectral index with respect to the true input spectral index ![]() (orange). The black curve is a Gaussian distribution with zero mean and unit variance. Vertical lines are the corresponding mean of the distribution. Lower panel: The two-dimensional density plot of true input and inferred βs map. The correlation between the two maps is 81%. The black dashed line correspond to 100% correlation.
(orange). The black curve is a Gaussian distribution with zero mean and unit variance. Vertical lines are the corresponding mean of the distribution. Lower panel: The two-dimensional density plot of true input and inferred βs map. The correlation between the two maps is 81%. The black dashed line correspond to 100% correlation.
Current usage metrics show cumulative count of Article Views (full-text article views including HTML views, PDF and ePub downloads, according to the available data) and Abstracts Views on Vision4Press platform.
Data correspond to usage on the plateform after 2015. The current usage metrics is available 48-96 hours after online publication and is updated daily on week days.
Initial download of the metrics may take a while.