Open Access
Fig. 1
Download original image
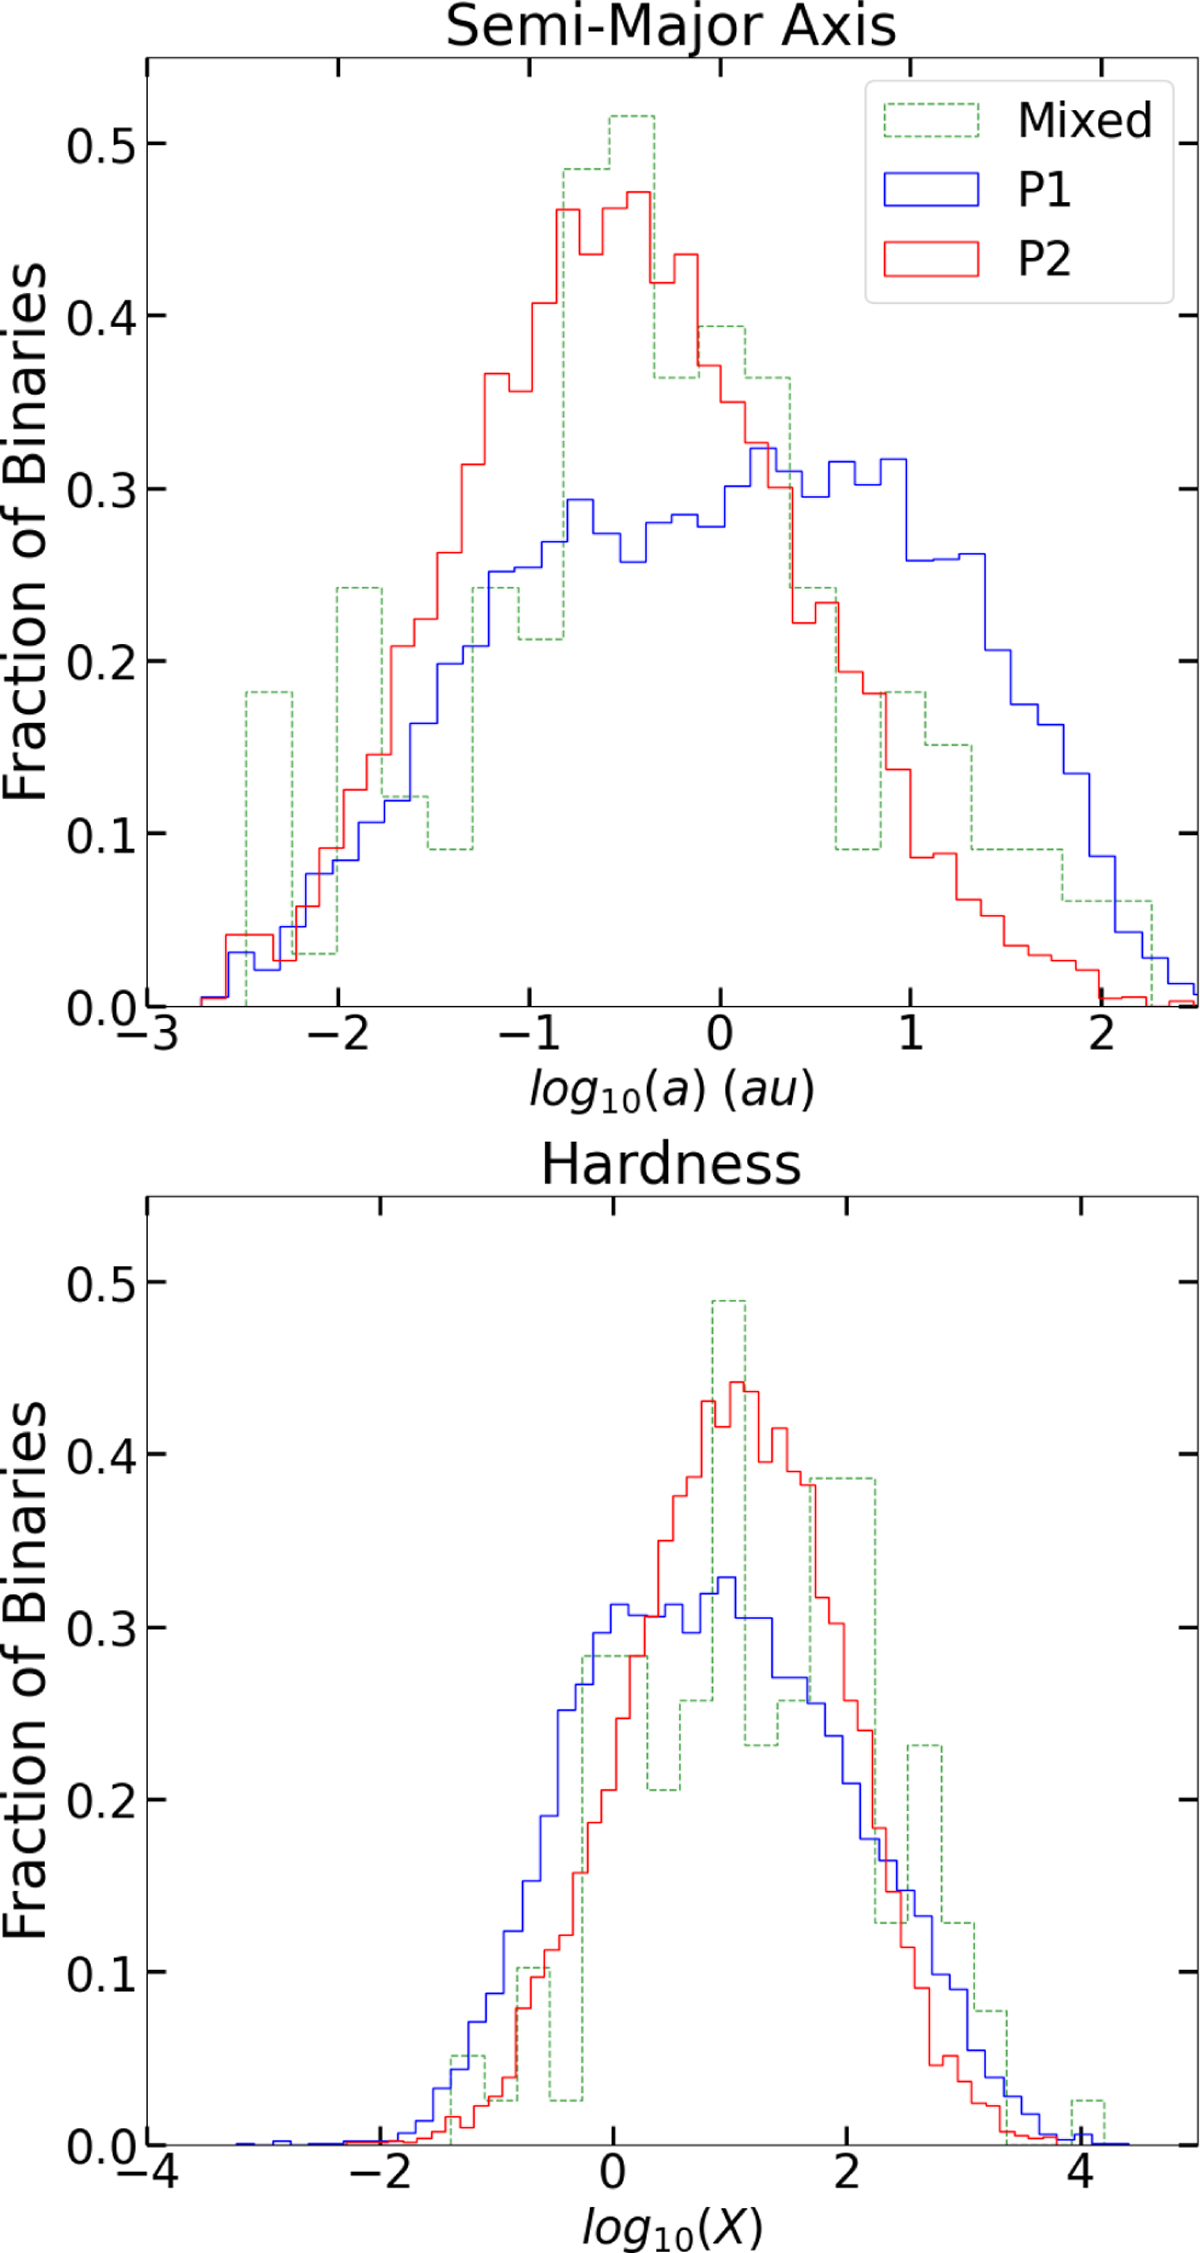
Distributions of the semimajor axes (top) and hardness values (bottom) of the P1 (blue), P2 (red), and mixed (green) binaries for the mr025c005fb10 simulation evolved to 12 Gyr and normalized such that the total area under each histogram equals 1.
Current usage metrics show cumulative count of Article Views (full-text article views including HTML views, PDF and ePub downloads, according to the available data) and Abstracts Views on Vision4Press platform.
Data correspond to usage on the plateform after 2015. The current usage metrics is available 48-96 hours after online publication and is updated daily on week days.
Initial download of the metrics may take a while.